
Share your love
How To Install and Configure Grafana on Debian 11

In this article, we want to teach you How To Install and Configure Grafana on Debian 11.
Grafana is an open-source solution for running data analytics, pulling up metrics that make sense of the massive amount of data & to monitor our apps with the help of cool customizable dashboards.
It connects with every possible data source, commonly referred to as databases such as Graphite, Prometheus, Influx DB, ElasticSearch, MySQL, PostgreSQL, etc.
Grafana being an open-source solution also enables us to write plugins from scratch for integration with several different data sources.
The tool helps us study, analyze & monitor data over a period of time, technically called time-series analytics.
How To Install and Configure Grafana on Debian 11
To install Grafana on Debian 11, you need to log in to your server as a non-root user with sudo privileges and set up a basic firewall. To do this, you can follow our article the Initial Server Setup with Debian 11.
Now follow the steps below to complete this guide.
Set up Grafana on Debian 11
First, you need to update your local package index with the following command:
sudo apt update
Then, you need to install the required packages on Debian 11:
sudo apt install gnupg2 curl software-properties-common dirmngr apt-transport-https lsb-release ca-certificates -y
By default, Grafana packages aren’t available in the default Debian repository. So you need to add it to your server.
Add the Grafana GPG key on Debian 11 with the command below:
curl https://packages.grafana.com/gpg.key | sudo apt-key add -Next, add the Grafana repository to your server:
add-apt-repository "deb https://packages.grafana.com/oss/deb stable main"Update your local package index:
sudo apt updateAt this point, you can install Grafana on your server with the following command:
sudo apt -y install grafanaWhen your installation is completed, you can start and enable your Grafana service to start on boot with the following commands:
# sudo systemctl start grafana-server
# sudo systemctl enable grafana-server
Verify that your Grafana service is active and running on Debian 11:
sudo systemctl status grafana-serverOutput grafana-server.service - Grafana instance Loaded: loaded (/lib/systemd/system/grafana-server.service; enabled; vendo> Active: active (running) since Mon 2022-04-18 06:27:57 EDT; 11s ago Docs: http://docs.grafana.org Main PID: 3138 (grafana-server) Tasks: 8 (limit: 2340) Memory: 36.1M CPU: 1.039s CGroup: /system.slice/grafana-server.service └─3138 /usr/sbin/grafana-server --config=/etc/grafana/grafana.ini >
Access Grafana Web Interface
At this point, we assumed that you have enabled UFW firewall from the requirements.
First, you need to allow Grafana port through the Debian 11 firewall with the following command:
sudo ufw allow 3000/tcpThen, reload the firewall to apply the new rules:
sudo ufw reload
Now you can access the Grafana We interface by typing your server’s IP address in your web browser followed by 3000:
http://Server_IP:3000/
You will see the Grafna login screen. The default username and password is admin.

But you’re required to change immediately after authenticating. Enter your desired password and click Submit.
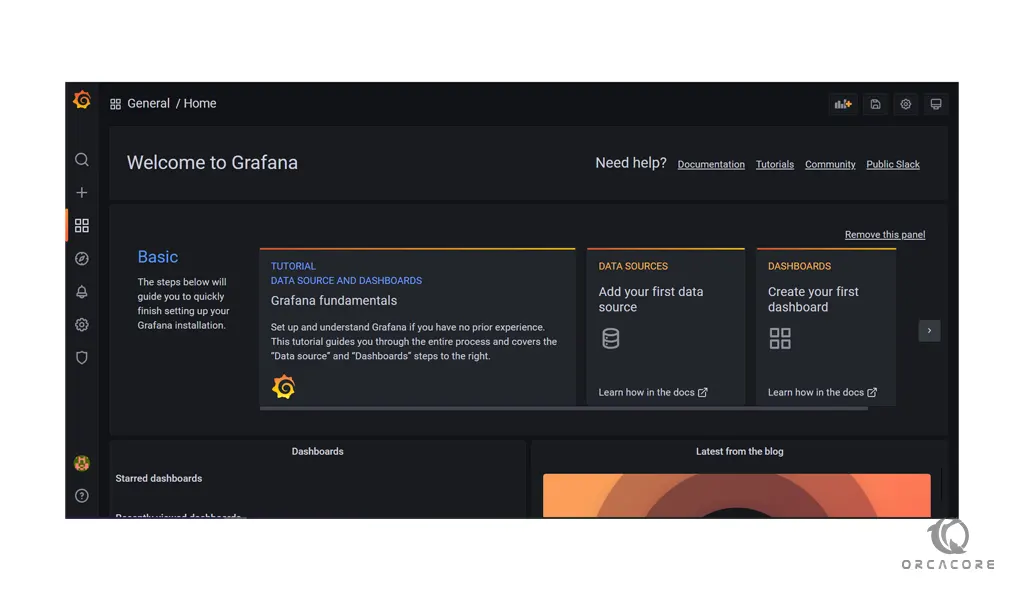
Then, you will see your Grafana dashboard.
Conclusion
With Grafana you can track the user behavior, application behavior, frequency of errors popping up in production or a pre-prod environment, type of errors popping up & the contextual scenarios by providing relative data.
Hope you enjoy this article about How To Install and Configure Grafana on Debian 11.