
Share your love
Install and Configure Grafana on Rocky Linux 8

In this guide, we want to teach you to Install and Configure Grafana on Rocky Linux 8.
Grafana is an open-source observability platform for visualizing metrics, logs, and traces collected from your applications. It’s a cloud-native solution for quickly assembling data dashboards that let you inspect and analyze your stack.
Install and Configure Grafana on Rocky Linux 8
To set up Grafana, you need to log in to your server as a non-root user with sudo privileges and set up a basic firewall. To do this, you can follow our article the Initial Server Setup with Rocky Linux 8.
Now follow the steps below to install Grafana on your server.
Set up and configure Grafana on Rocky Linux 8
You can install Grafana in a few ways on your server. In this guide, you will learn to install Grafana by creating the Grafana repository.
First, create and open the Grafana repo file with your favorite text editor, here we use vi:
sudo vi /etc/yum.repos.d/grafana.repo
Then, add the following content to the file:
[grafana]
name=grafana
baseurl=https://packages.grafana.com/oss/rpm
repo_gpgcheck=1
enabled=1
gpgcheck=1
gpgkey=https://packages.grafana.com/gpg.key
sslverify=1
sslcacert=/etc/pki/tls/certs/ca-bundle.crt
When you are done, save and close the file.
Now update your local package index with the following command:
sudo dnf update -y
Here you can install Grafana with the command below:
sudo dnf install grafana
When your installation is completed, start your Grafana service on Rocky Linux 8 with the following command:
sudo systemctl start grafana-server
If you want to enable your service to start at boot run the following command:
sudo systemctl enable grafana-server
You can verify that your Grafana service is active and running on your Rocky Linux 8 with the following command:
sudo systemctl status grafana-server
In your output you will see:
Output
grafana-server.service - Grafana instance
Loaded: loaded (/usr/lib/systemd/system/grafana-server.service; enabled; ven>
Active: active (running) since Sat 2021-12-11 08:55:48 EST; 2min 20s ago
Docs: http://docs.grafana.org
Main PID: 89091 (grafana-server)
Tasks: 9 (limit: 11409)
Memory: 43.5M
CGroup: /system.slice/grafana-server.service
└─89091 /usr/sbin/grafana-server --config=/etc/grafana/grafana.ini ->
We assumed that you have enabled the firewall from the requirements.
At this point, you need to allow traffic for Grafana on port 3000 through the firewall on Rocky Linux 8. To do this, run the following command:
sudo firewall-cmd --add-port=3000/tcp --permanent
Now reload the firewall to apply the new rules:
sudo firewall-cmd --reload
Access Grafana Web Interface
At this step, you can access the Grafana web interface on Rocky Linux 8 by typing your server’s IP address in your web browser followed by 3000:
http://your-server-ip-address:3000
You will see the Grafana login screen:

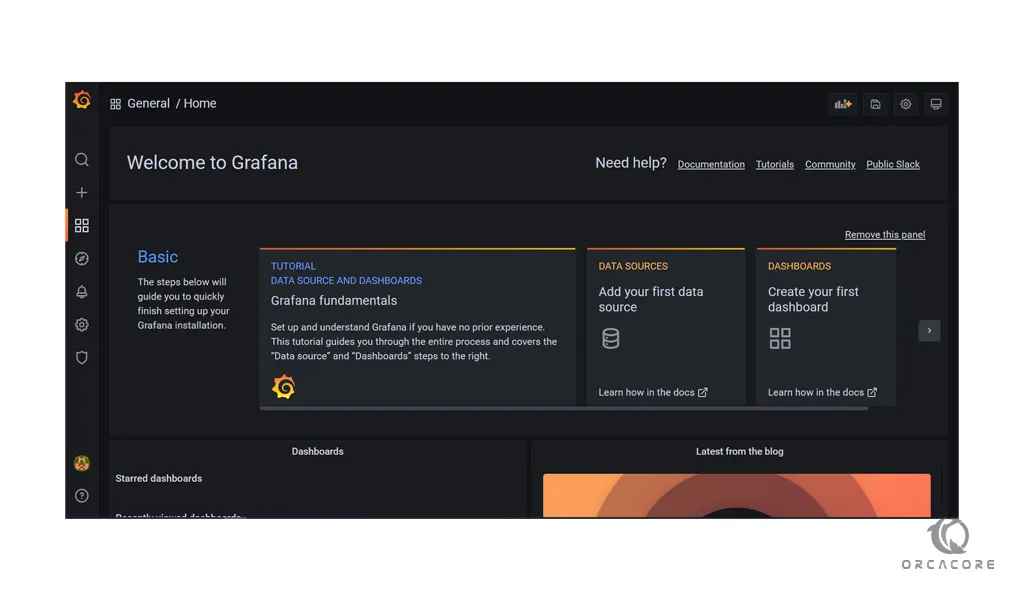
At this window, enter admin for the username and password and you can change the password of your Grafana. Then, you will see the Grafana welcome dashboard screen:
Conclusion
At this point, you learn to Install and Configure Grafana on Rocky Linux 8.
Hope you enjoy it.