
Share your love
Install Grafana on AlmaLinux 9 | Best Monitoring Tool

In this guide from the OrcaCore Website, you will learn How To Install Grafana on AlmaLinux 9. Grafana is an open-source software that is used for visualization and analytics. You can follow this article to set up your Grafana and access your Grafana dashboard.
Table of Contents
How To Install Grafana on AlmaLinux 9?
To complete this guide, you must log in to your server as a non-root user with sudo privileges and set up a basic firewall. To do this, you can follow our guide on the Initial Server Setup with AlmaLinux 9.
Now follow the steps below to complete this guide.
Step 1. Download Grafana RPM Package on AlmaLinux 9
First, you need to update your local package index with the following command:
sudo dnf update -yIn this guide, you will learn to install Grafana by using an RPM package on AlmaLinux 9.
Visit the Grafana Downloads page and get the RPM package with the command below:
sudo wget https://dl.grafana.com/oss/release/grafana-VERSION.x86_64.rpmAt the current time, the latest version of Grafana is 9.1.6:
sudo wget https://dl.grafana.com/oss/release/grafana-9.1.6-1.x86_64.rpmThen, use the following command to install Grafana:
sudo dnf install grafana-9.1.6-1.x86_64.rpm -yStep 2. How To Start Grafana Service?
When your installation is complete, reload the system daemon with the command:
sudo systemctl daemon-reloadNow start and enable the Grafana service by running the commands below:
# sudo systemctl start grafana-server
# sudo systemctl enable grafana-server
Verify your Grafana service is active and running on AlmaLinux 9:
sudo systemctl status grafana-serverOutput
● grafana-server.service - Grafana instance
Loaded: loaded (/usr/lib/systemd/system/grafana-server.service; enabled; v>
Active: active (running) since Thu 2022-09-22 04:09:53 EDT; 11s ago
Docs: http://docs.grafana.org
Main PID: 5010 (grafana-server)
Tasks: 7 (limit: 23609)
Memory: 39.7M
CPU: 942ms
CGroup: /system.slice/grafana-server.service
└─5010 /usr/sbin/grafana-server --config=/etc/grafana/grafana.ini Step 3. Configure Firewall Settings For Grafana
The Grafana server listens on port 3000 by default, you can verify this with the command below:
sudo ss -plunt|grep grafanaOutput
tcp LISTEN 0 4096 *:3000 *:* users:(("grafana-server",pid=5010,fd=8))At this point, you need to allow port Grafana, which is 3000, through the firewall on AlmaLinux 9. To do this, run the following command:
sudo firewall-cmd --add-port=3000/tcp --permanentNow reload the firewall to apply the new rules:
sudo firewall-cmd --reloadStep 4. How To Access Grafana Web Console?
At this step, you can access the Grafana web interface on ALmaLinux 9 by typing your server’s IP address in your web browser, followed by 3000:
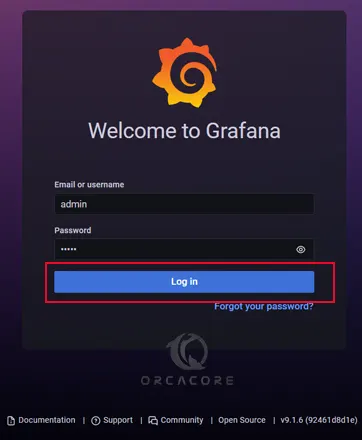
http://your-server-ip-address:3000You will see the Grafana login screen. At this window, enter admin for the username and password and click Log in.
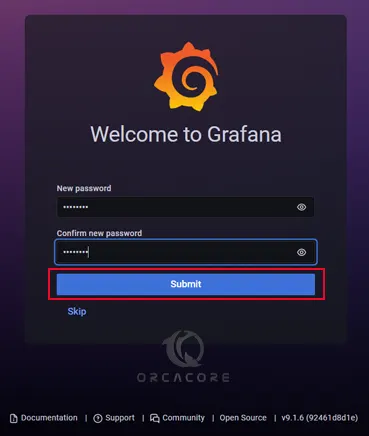
Then, change the default password of Grafana and click submit.
At this point, you will see the Grafana welcome dashboard screen:
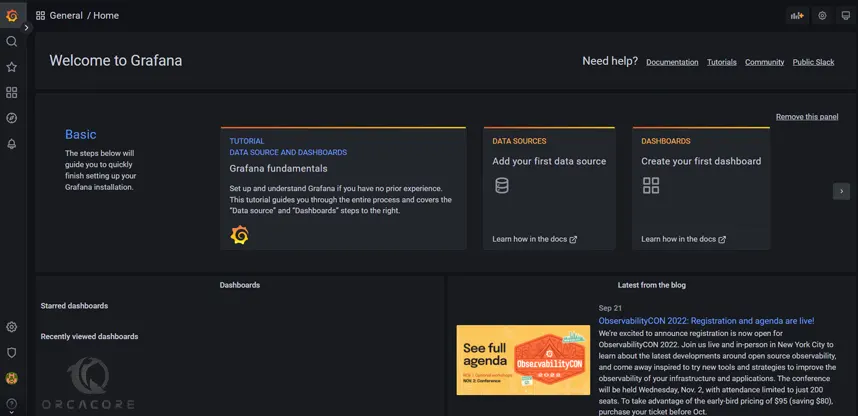
That’s it, you are done. From here, you can start using your Grafana.
Conclusion
At this point, you have learned to Install Grafana on AlmaLinux 9 by using an RPM package and starting your Grafana service, and accessing your Grafana dashboard.
Hope you enjoy it. Please subscribe to us on Facebook, Instagram, and YouTube.
Also, you may like to read the following articles:
Setting Up Linux Kernel 6.14 on Ubuntu 24.04
Install Python 3.13 on AlmaLinux
VirtualBox Setup on AlmaLinux 9
FAQs
Where is the Grafana Configuration File?
You can customize Grafana by editing the configuration file at /etc/grafana/grafana.ini to suit your preference.
Which port does Grafana use by default?
Grafana uses port 3000 by default. Make sure to allow it in the firewall.
How do I change the default Grafana admin password?
After the first login, Grafana will prompt you to change it.
Is SELinux an issue when installing Grafana?
Grafana usually works fine with SELinux in enforcing mode, but you might need to adjust policies if using external plugins or custom data sources.