
Share your love
Install Monitorix on Debian 11: Easy Monitoring

This tutorial intends to teach you to Install Monitorix on Debian 11. If you plan to monitor your services on Linux, Monitorix is a good monitoring tool for you. With Monitorix, you can monitor many things, such as:
- CPU load and temperature
- Network device activity
- Network services
This guide on the Orcacore website will show you how to install and make Monitorix configuration and perform simple and Multi-Host monitoring on Debian 11.
If you are looking for Monitorix installation instructions on AlmaLinux and Ubuntu, you can visit these guides:
Install and Configure Monitorix on Ubuntu 22.04
How To Install Monitorix on AlmaLinux 8
Table of Contents
How To Install Monitorix on Debian 11?
To complete Monitorix configuration, you must have access to your server as a non-root user with sudo privileges, and set up a basic firewall with UFW. To do this, you can follow our guide on Initial Server Setup with Debian 11.
Now follow the steps below to complete the Monitorix configuration.
Step 1 – Monitorix Installation on Debian 11
Monitorix packages are available in the default Debian 11 repository. First, you must run the system update to update your local packages:
sudo apt updateThen, run the command below in your terminal to install Monitorix and the required packages:
sudo apt install monitorix rrdtool perl libwww-perl libmailtools-perl libmime-lite-perl librrds-perl libdbi-perl libxml-simple-perl libhttp-server-simple-perl libconfig-general-perl libio-socket-ssl-perl -yStep 2 – Verify Monitorix Installation
When your installation is completed, you can verify your Monitorix installation by checking its version. To do this, run the following command:
monitorix -vIn your output, you will see:
Output
Monitorix version 3.12.0 (21-Feb-2020)
Step 3 – Start and Enable Monitorix Service
At this point, you must start and enable your Monitorix service to start on the boot system.
To perform this task, you can run the following command:
sudo systemctl enable --now monitorixThen, verify your Monitorix service is active and running on your Debian 11 with the following command:
sudo systemctl status monitorixYou should get the following output:
Output
● monitorix.service - Monitorix
     Loaded: loaded (/lib/systemd/system/monitorix.service; enabled; vendor pre>
     Active: active (running) since Tue 2023-05-23 03:42:42 EDT; 4min 5s ago
       Docs: man:monitorix(8)
   Main PID: 2509 (/usr/bin/monito)
      Tasks: 2 (limit: 4679)
     Memory: 80.6M
        CPU: 1.231s
     CGroup: /system.slice/monitorix.service
             ├─2509 /usr/bin/monitorix -c /etc/monitorix/monitorix.conf -p /run>
             └─2592 monitorix-httpd listening on 8080
...
Now proceed to the next step to configure your Monitorix service.
Step 4 – Configure Monitorix on Debian 11
You can easily configure your Monitorix service by using a simple text file /etc/monitorix/monitorix.conf.
Before you start using your Monitorix, you need to make some changes to this Monitorix configuration file.
First, it is highly recommended to take a copy of the Monitorix config file. To do this, you can use the following command:
sudo cp /etc/monitorix/monitorix.conf /etc/monitorix/monitorix.conf.backupThen, open the Monitorix configuration file on Debian 11 by using your desired text editor, here we use the vi editor:
sudo vi /etc/monitorix/monitorix.confFrom the Monitorix configuration file, replace the following settings as your environment:
# line 6: change to any title you like
title = Monitorix

# line 7: change to your hostname
hostname = your-hostname

# line 8: background color of admin site
theme_color = black

# line 12: change network units to bps (default is Bytes per/sec)
netstats_in_bps = y

# 28-43: change if you need
<httpd_builtin>
        enabled = y
        host =
        port = 8080
        user = nobody
        group = nobody
        log_file = /var/log/monitorix-httpd
        # if enable permission for admin site, add settings
        hosts_deny = all
        hosts_allow = 10.0.0.0/24
        autocheck_responsiveness = y
        <auth>
                # if enable Basic auth, turn to [y]
                enabled = n
                msg = Monitorix: Restricted access
                htpasswd = /var/lib/monitorix/htpasswd
        </auth>
</httpd_builtin>

# line 76: set kind of graphs you'd like to monitor
# Graphs (de)activation
# -----------------------------------------------------------------------------
<graph_enable>
        system          = y
        kern            = y
        proc            = y
        hptemp          = n
        lmsens          = n
        gensens         = n
        ipmi            = n
        ambsens         = n
        nvidia          = n
        disk            = n
.....
.....
When you are done with the Monitorix configuration, save and close the file.
To apply the changes, restart the Monitorix service on Debian 11:
sudo systemctl restart monitorixConfigure Firewall for Monitorix
If you have a running firewall with UFW, you must open port 8080 to enable access using the command below:
sudo ufw allow 8080/tcpReload the firewall to apply the new rules:
sudo ufw reloadStep 5 – How To Access Monitorix Dashboard?
To access your Monitorix through the web interface, you need to type your server’s IP address in your web browser followed by 8080/monitorix:
http://server-ip-address:8080/monitorixPerform Simple Monitoring with Monitorix
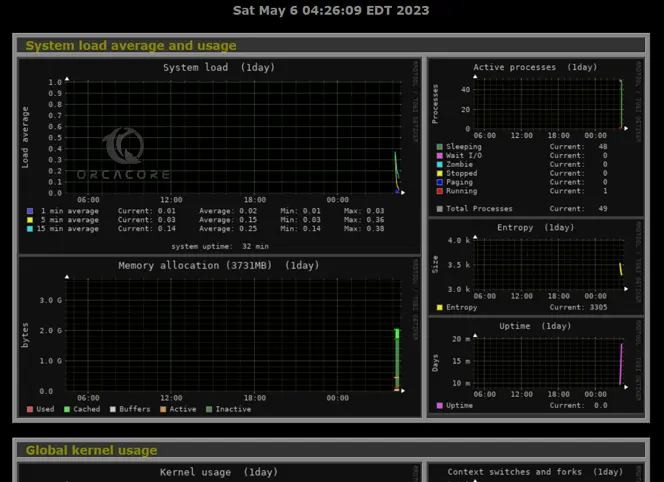
At the first screen, choose the graph and the daily, weekly, monthly, or yearly options and click ok.
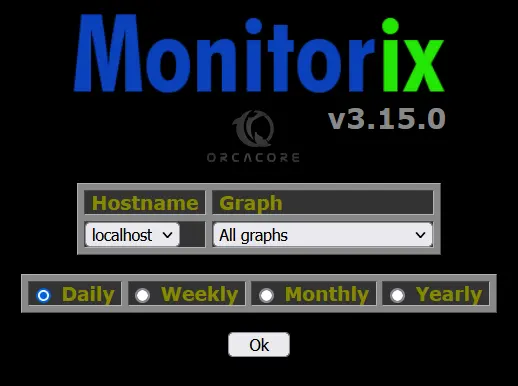
From there, you can see your graphs and monitor your server.
Step 6 – How To Enable Multi-Host Monitoring with Monitorix?
If you plan to configure Monitorix on another node, you must set a monitoring target node in the Monitorix config file. To do this, open the Monitorix config file on Debian 11:
sudo vi /etc/monitorix/monitorix.confIn the file, search for the <multihost> section. And make the Monitorix configuration as shown below:
<multihost>
        # enable with [y]
        enabled = y
        footer_url = y
        graphs_per_row = 2
        default_option_when_all = "System load"
        # remote host list (display name)
        remotehost_list = Enter your Node List Here
        #remotehost_list = server 1, server 2, server 3
        <remotehost_desc>
                # access path of remote hosts
                 0 = http://node.example.com:8080,/monitorix
                #0 = http://www.example.com,/monitorix,/monitorix-cgi
                #1 = http://10.0.0.1,/monitorix,/monitorix-cgi
                #2 = http://192.168.0.100:8080,/,/
        </remotehost_desc>
        groups = n
        remotegroup_list = My Group
        <remotegroup_desc>
                0 = server 2, server 3
        </remotegroup_desc>
</multihost>
When you are done, save and close the file.
To apply the changes, restart Monitorix:
sudo systemctl restart monitorixThen, access your Node controller from the web interface, for example, http://node.example.com:8080,/monitorix, and click the [Hostname], then you can select a Node and click ok.
From there, you can see your Node graphs.
That’s it you are done.
Conclusion
At this point, you have learned to install land configure Monitorix on Debian 11. You can see how to configure Monitorix to perform simple monitoring and enable Multi-Host monitoring. It is an easy-to-use Monitoring tool on Linux.
Hope you enjoy it. You may also interested in these articles too: