
Share your love
Install Wireshark on AlmaLinux 8 – Easy Steps

In this tutorial, we want to teach you How To Install Wireshark on AlmaLinux 8. Wireshark is an open-source tool for profiling network traffic and analyzing packets. Such a tool is often referred to as a network analyzer, network protocol analyzer, or sniffer.
Wireshark helps:
- Network administrators troubleshoot problems across a network
- Security engineers examine security issues across a network
- QA engineers verify applications
- Developers debug protocol implementations
- Network users learn about a specific protocol
You can now proceed to the following steps provided by the Orcacore team to Install Wireshark on AlmaLinux 8.
Table of Contents
Steps To Install Wireshark on AlmaLinux 8
To Install Wireshark on AlmaLinux 8, you must log in to your server as a root or non-root user with sudo privileges. To do this, you can follow our guide on Initial Server Server Setup with AlmaLinux 8.
Step 1 – Install Wireshark on AlmaLinux 8
By default, Wireshark packages are available in the default AlmaLinux repository.
First, update your local package index with the following command:
sudo dnf update -yThen, use the following command to install the Wireshark GUI App on your server:
sudo dnf install wireshark -yNote: If you do not have GUI/Desktop installed you can install and use Wireshark as a command line tool. To do this, run the command below:
sudo dnf install wireshark-cli -yStep 2 – How To Launch Wireshark on AlmaLinux 8?
At this point, you have learned to Install Wireshark on AlmaLinux 8 both GUI and CLI. You can now launch Wireshark either from the command line or from the activities.
To start Wireshark, run the following command:
sudo wireshark &You will see the Wireshark interface on AlmaLinux 8:
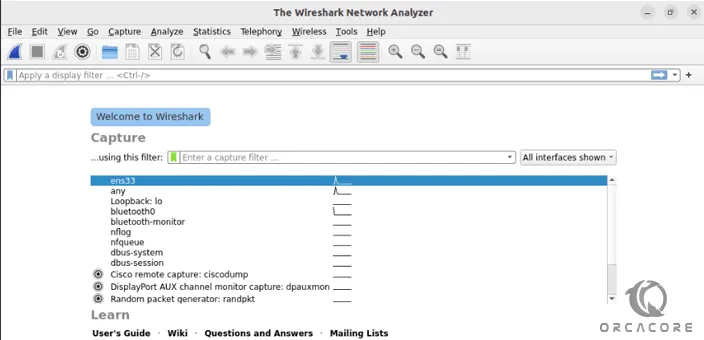
Now you can start using your Wireshark. For example, you can Capture the data from available network interfaces. To do this, click on the shark flipper icon in the top left corner to start recording.
In case you wish to use the command line Wireshark tools use the following command:
tshark --helpOutput
Usage: tshark [options] ...
Capture interface:
-i <interface> name or idx of interface (def: first non-loopback)
-f <capture filter> packet filter in libpcap filter syntax
-s <snaplen> packet snapshot length (def: appropriate maximum)
-p don't capture in promiscuous mode
-I capture in monitor mode, if available
-B <buffer size> size of kernel buffer (def: 2MB)
-y <link type> link layer type (def: first appropriate)
--time-stamp-type <type> timestamp method for interface
-D print list of interfaces and exit
-L print list of link-layer types of iface and exit
--list-time-stamp-types print list of timestamp types for iface and exit
Capture stop conditions:
-c <packet count> stop after n packets (def: infinite)
-a <autostop cond.> ... duration:NUM - stop after NUM seconds
filesize:NUM - stop this file after NUM KB
files:NUM - stop after NUM files
Capture output:
-b <ringbuffer opt.> ... duration:NUM - switch to next file after NUM secs
interval:NUM - create time intervals of NUM secs
filesize:NUM - switch to next file after NUM KB
files:NUM - ringbuffer: replace after NUM files
Input file:
-r <infile> set the filename to read from (- to read from stdin)
Processing:
-2 perform a two-pass analysis
-M <packet count> perform session auto reset
-R <read filter> packet Read filter in Wireshark display filter syntax
(requires -2)
-Y <display filter> packet displaY filter in Wireshark display filter
syntax
-n disable all name resolutions (def: all enabled)
-N <name resolve flags> enable specific name resolution(s): "mnNtdv"
-d <layer_type>==<selector>,<decode_as_protocol> ...
"Decode As", see the man page for details
Example: tcp.port==8888,http
-H <hosts file> read a list of entries from a hosts file, which will
then be written to a capture file. (Implies -W n)
--enable-protocol <proto_name>
enable dissection of proto_name
--disable-protocol <proto_name>
disable dissection of proto_name
--enable-heuristic <short_name>
enable dissection of heuristic protocol
--disable-heuristic <short_name>
disable dissection of heuristic protocol
Output:
-w <outfile|-> write packets to a pcap-format file named "outfile"
(or to the standard output for "-")
-C <config profile> start with specified configuration profile
-F <output file type> set the output file type, default is pcapng
an empty "-F" option will list the file types
-V add output of packet tree (Packet Details)
-O <protocols> Only show packet details of these protocols, comma
separated
...For more information, you can visit the Wireshark Documentation page.
Conclusion
Monitoring your network traffic can help to stop cyber attacks or just improve connection speeds. It can also help you chase down problem applications.
Hope you enjoy this guide on Install Wireshark on AlmaLinux 8.
You may also like these articles:
How To Disable SELinux on AlmaLinux
Enable RPM Fusion Repository on AlmaLinux 9
How To Install XAMPP on AlmaLinux 9
FAQs
What is Wireshark and Why We Should Use it?
Wireshark is a powerful open-source network protocol analyzer that helps you capture and examine network traffic in real time. It’s useful for network troubleshooting, security analysis, and learning about network protocols. For these purposes, you must Install Wireshark on AlmaLinux 8.
Can I capture network traffic as a non-root user in Wireshark?
By default, only the root user can capture network traffic. But, you can allow non-root users to capture traffic by adding them to the wireshark group with the command below:sudo usermod -aG wireshark [your-username]After that, you need to configure permissions by running:sudo setcap cap_net_raw,cap_net_admin=eip /usr/bin/dumpcapThen, log out and log back in to apply the changes.