
Share your love
How To Install Grafana on Ubuntu 20.04

In this article, we want to teach you How To Install Grafana on Ubuntu 20.04.
Grafana is an open-source solution for running data analytics, pulling up metrics that make sense of the massive amount of data & to monitor our apps with the help of cool customizable dashboards.
It connects with every possible data source, commonly referred to as databases such as Graphite, Prometheus, Influx DB, ElasticSearch, MySQL, PostgreSQL, etc.
How To Install Grafana on Ubuntu 20.04
Before you start to set up Grafana on Ubuntu 20.04, you need some requirements first.
Requirements
You need to log in to your server as a non-root user with sudo privileges. To do this, you can check our article the Initial Server Setup with Ubuntu 20.04.
Then, you need to have Nginx installed on your server. To do this, you can follow our article about How To Install Nginx on Ubuntu 20.04.
An Nginx server block is configured with Let’s Encrypt. For this, you can visit our article about how to Secure Nginx with Let’s Encrypt on Ubuntu 20.04.
Also, you need a domain name that points to your IP address.
Now you can follow the steps below to set up Grafana on Ubuntu 20.04.
Set up Grafana on Ubuntu 20.04
Grafana is not available in the default Ubuntu repository. So you need to add the Grafana repository to your server.
First, add the GPG public key with the following command:
sudo wget -q -O - https://packages.grafana.com/gpg.key | sudo apt-key add -Then, add the Grafana repo on Ubuntu 20.04 with the following command:
sudo add-apt-repository "deb https://packages.grafana.com/oss/deb stable main"
Update your local package index with the following command:
sudo apt update
Here you can install Grafana with the following command:
sudo apt install grafanaVerify your Grafana installation by checking its version:
grafana-server -vIn your output you will see:
Output
Version 8.3.1 (commit: 8d38082755, branch: HEAD)
Now start and enable the Grafana service to start at boot with the following commands:
sudo systemctl enable grafana-serversudo systemctl start grafana-serverYou can check that your Grafana service is active and running on Ubuntu 20.04 with the command below:
sudo systemctl status grafana-serverIn your output you will see:
Output
grafana-server.service - Grafana instance
Loaded: loaded (/lib/systemd/system/grafana-server.service; enabled; vendo>
Active: active (running) since Wed 2021-12-08 11:06:00 CET; 1min 17s ago
Docs: http://docs.grafana.org
Main PID: 2445 (grafana-server)
Tasks: 8 (limit: 2282)
Memory: 30.4M
CGroup: /system.slice/grafana-server.service
└─2445 /usr/sbin/grafana-server --config=/etc/grafana/grafana.ini
Set up Reverse Proxy for Grafana
At this step, you should reconfigure Nginx as a reverse proxy for Grafana on Ubuntu 20.04.
Open the Nginx configuration file that you have created in the requirements part with your favorite text editor, here we use vi:
sudo vi /etc/nginx/sites-available/example.com
Find the following lines in the file:
...
location / {
try_files $uri $uri/ =404;
}
...
You need to tell Nginx to forward all requests to Grafana on Ubuntu 20.04, which runs on port 3000 by default.
Delete the try_files line and replace it with the proxy_pass option:
...
location / {
proxy_pass http://localhost:3000;
}
...
When you are done, save and close the file.
To make sure that everything is ok, you can run the following command:
sudo nginx -t
In your output you will see:
Output
nginx: the configuration file /etc/nginx/nginx.conf syntax is ok
nginx: configuration file /etc/nginx/nginx.conf test is successful
To apply the changes reload Nginx with the following command:
sudo systemctl reload nginx
Now you can access the Grafana web interface on Ubuntu 20.04 by typing your domain name in your web browser:
https://your-domain-name
You will see the login interface:

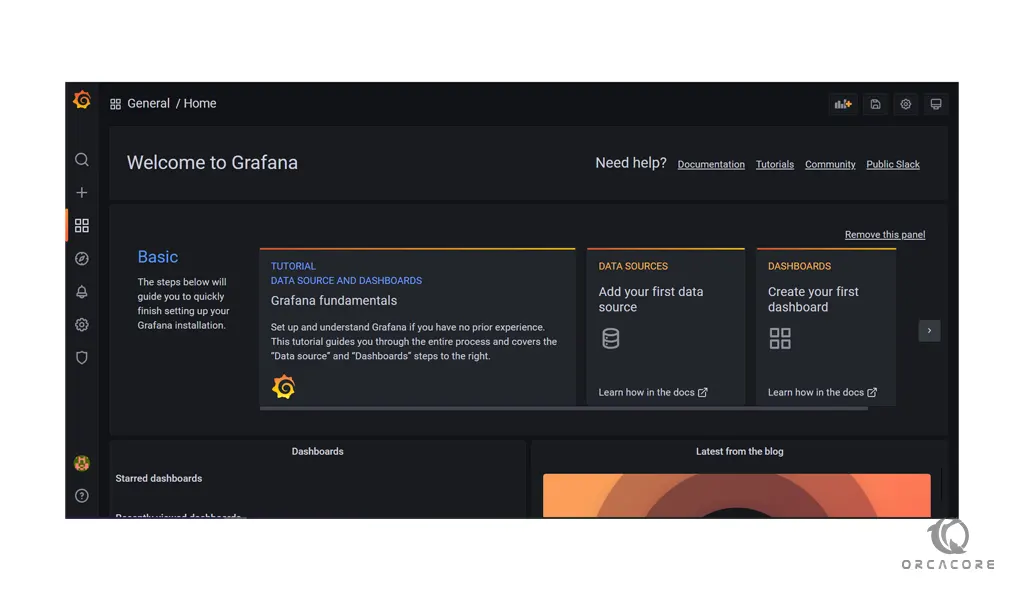
Enter admin for the username and password, then you’ll be asked to renew your password. When you have changed your password you will see the Grafana welcome dashboard:
Conclusion
At this point, you learn to install and configure Grafana on Ubuntu 20.04.
Hope you enjoy using it.