
Share your love
How To Install Grafana on Ubuntu 22.04

In this guide on the Orcacore website, we want to teach you How To Install Grafana on Ubuntu 22.04. Grafana is an open-source analytics and interactive visualization web application. It allows you to ingest data from a huge number of data sources, query this data, and display it on beautiful, customizable charts for easy analysis.
It is also possible to set alerts so you can quickly and easily be notified of abnormal behavior and lots more. In simple terms, Grafana allows you to transform the mountain of performance metric data collected from your applications into visualizations. This will allow you to draw conclusions and make decisions to keep your application stack healthy.
Table of Contents
Steps To Install Grafana on Ubuntu 22.04
To complete this guide, you must log in to your server as a non-root user with sudo privileges and set up a basic firewall. To do this, you can follow our guide on the Initial Server Setup with Ubuntu 22.04.
And you need to have Nginx installed on your server to use it as a reverse proxy for Grafana. To do this, you can follow the installation part of our article about How to Install Nginx on Ubuntu 22.04.
Also, you need a domain name that points to your IP address.
1. Add Grafana Repository To Ubuntu 22.04
Grafana is not available in the default Ubuntu repository. So you need to add the Grafana repository to your server.
First, install the required packages with the command below:
sudo apt install -y gnupg2 wget software-properties-commonThen, add the GPG public key with the following command:
sudo wget -q -O - https://packages.grafana.com/gpg.key | sudo apt-key add -Next, add the Grafana repo on Ubuntu 22.04 with the following command:
sudo add-apt-repository "deb https://packages.grafana.com/oss/deb stable main"Update your local package index with the following command:
sudo apt update2. Install Grafana with APT on Ubuntu 22.04
Here you can install Grafana with the following command:
sudo apt install grafana -yVerify your Grafana installation by checking its version:
grafana-server -vIn your output, you will see:
Output
Version 9.1.6 (commit: 92461d8d1e, branch: HEAD)
3. Start and Enable Grafana Service
Now start and enable the Grafana service to start at boot with the following commands:
sudo systemctl enable grafana-serversudo systemctl start grafana-serverYou can check that your Grafana service is active and running on Ubuntu 22.04 with the command below:
sudo systemctl status grafana-serverIn your output, you will see:
Output
● grafana-server.service - Grafana instance
     Loaded: loaded (/lib/systemd/system/grafana-server.service; enabled; vendo>
     Active: active (running) since Thu 2022-09-22 09:13:38 UTC; 9s ago
       Docs: http://docs.grafana.org
   Main PID: 4023 (grafana-server)
      Tasks: 10 (limit: 4575)
     Memory: 37.3M
        CPU: 1.046s
     CGroup: /system.slice/grafana-server.service
             └─4023 /usr/sbin/grafana-server --config=/etc/grafana/grafana.ini
4. Configure Firewall For Grafana
Grafana’s default http port is 3000, you’ll need to allow access to this port on the firewall. Here we assumed that you have enabled the UFW firewall from the requirements.
Open port 3000 on the Ubuntu 22.04 firewall:
sudo ufw allow 3000/tcpTo allow access only from a specific subnet, you can use the following command:
sudo ufw allow from 192.168.50.0/24 to any port 3000Reload the firewall to apply the new rules:
sudo ufw reload5. Set up Nginx as a Reverse Proxy for Grafana on Ubuntu 22.04
At this point, you will need to configure Nginx as a reverse proxy for Grafana to access it via port 80. First, you need to create an Nginx virtual host configuration file with your favorite text editor, here we use vi:
sudo vi /etc/nginx/conf.d/grafana.confAdd the following content to the file:
server {
        server_name example.com;
        listen 80;
        access_log /var/log/nginx/grafana.log;


        location / {
                proxy_pass http://localhost:3000;
                proxy_set_header Host $http_host;
                proxy_set_header X-Forwarded-Host $host:$server_port;
                proxy_set_header X-Forwarded-Server $host;
                proxy_set_header X-Forwarded-For $proxy_add_x_forwarded_for;
        }
}
When you are done, save and close the file.
To make sure that everything is ok, you can run the following command:
sudo nginx -tIn your output, you will see:
Output
nginx: the configuration file /etc/nginx/nginx.conf syntax is ok
nginx: configuration file /etc/nginx/nginx.conf test is successful
Next, restart the Nginx to apply the configuration changes:
sudo systemctl restart nginxYou can also check the Nginx status with the following command:
sudo systemctl status nginxYou will get the following output:
Output
● nginx.service - A high performance web server and a reverse proxy server
     Loaded: loaded (/lib/systemd/system/nginx.service; enabled; vendor preset:>
     Active: active (running) since Thu 2022-09-22 09:25:06 UTC; 16s ago
       Docs: man:nginx(8)
    Process: 5595 ExecStartPre=/usr/sbin/nginx -t -q -g daemon on; master_proce>
    Process: 5596 ExecStart=/usr/sbin/nginx -g daemon on; master_process on; (c>
   Main PID: 5599 (nginx)
      Tasks: 3 (limit: 4575)
     Memory: 3.3M
        CPU: 44ms
...
Now Nginx is configured as a reverse proxy for Grafana on Ubuntu 22.04. You can now proceed to the next step.
6. Access Grafana Dashboard Web Console
At this point, you can access the Grafana web interface on Ubuntu 22.04 by typing your domain name in your web browser, followed by 3000:
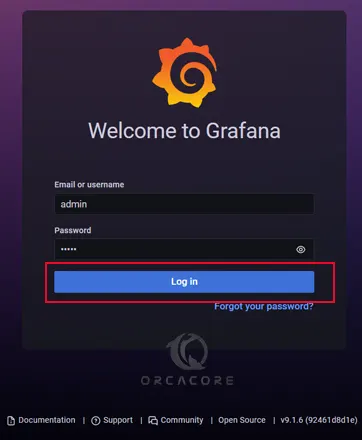
http://your-domain-name:3000You will see the login interface. Enter admin for the username and password and click Log in.
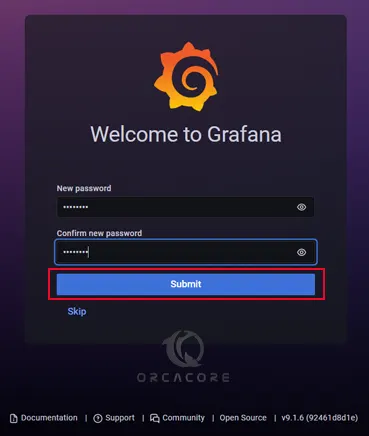
Then you’ll be asked to renew your password and click submit.
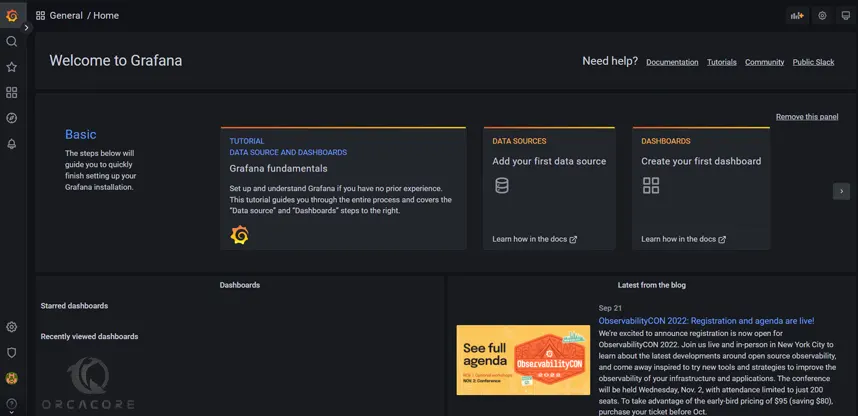
When you have changed your password, you will see the Grafana welcome dashboard:
Now you can proceed to the next step to secure your Grafana service.
7. Secure Grafana with Let’s Encrypt
At this point, you will need to install the Certbot client package to install and manage the Let’s Encrypt SSL. To do this, run the command below:
sudo apt install certbot python3-certbot-nginx -yOnce the installation is finished, run the following command to install the Let’s Encrypt SSL on your website:
sudo certbot --nginx -d example.comYou will be asked to enter your Email address and accept the terms of service:

Now you can load your website by https:// and notice your browser’s security indicator.
https://your-domainAs you know, Let’s Encrypt certificates are valid for 90 days. Because of this, you can renew your process.
You can test the renewal process with certbot:
sudo certbot renew --dry-run
Conclusion
At this point, you have learned to install the Latest Grafana on Ubuntu 22.04 and set up Nginx as a reverse proxy for it. Also, you have learned to secure Grafana with Let’s Encrypt.
Hope you enjoy it. Please subscribe to us on Facebook, X, and YouTube.
You may also like to read the following articles:
Installing bmon on Ubuntu 22.04