
Share your love
Monitor Linux Network Bandwidth Usage with nload Command

In this guide from the Orcacore website, we want to teach you to Monitor Linux Network Bandwidth Usage with nload Command.
nload is a command-line utility that can be used to monitor network traffic and bandwidth usage in real-time. It visualizes the incoming and outgoing traffic using two graphs and also provides additional information like min/max network usage and total transferred data.
Proceed to the rest of the article to start monitoring Linux network bandwidth usage by using the nload command line utility.
Table of Contents
How to Monitor Linux Network Bandwidth Usage with nload Command?
In this guide, you will learn how to install and use nload to monitor Linux network traffic and bandwidth utilization in real-time. Log in to your server as a root user or a non-root user with sudo privileges, then follow the steps below to complete this guide.
1. Install nload on Centos / RHEL / Fedora
nload can be easily installed by enabling the EPEL repository on CentOS or RHEL-based systems.
First, install EPEL with the following command:
yum install epel-release -y
or
dnf install epel-release -y
Then, use the following command to install the nload command:
yum install nload -y
or
dnf install nload -y
2. Install nload on Ubuntu / Debian
On Debian/Ubuntu, nload can be installed from the default system repositories as shown.
apt install nload -y3. Available nload Tool Options
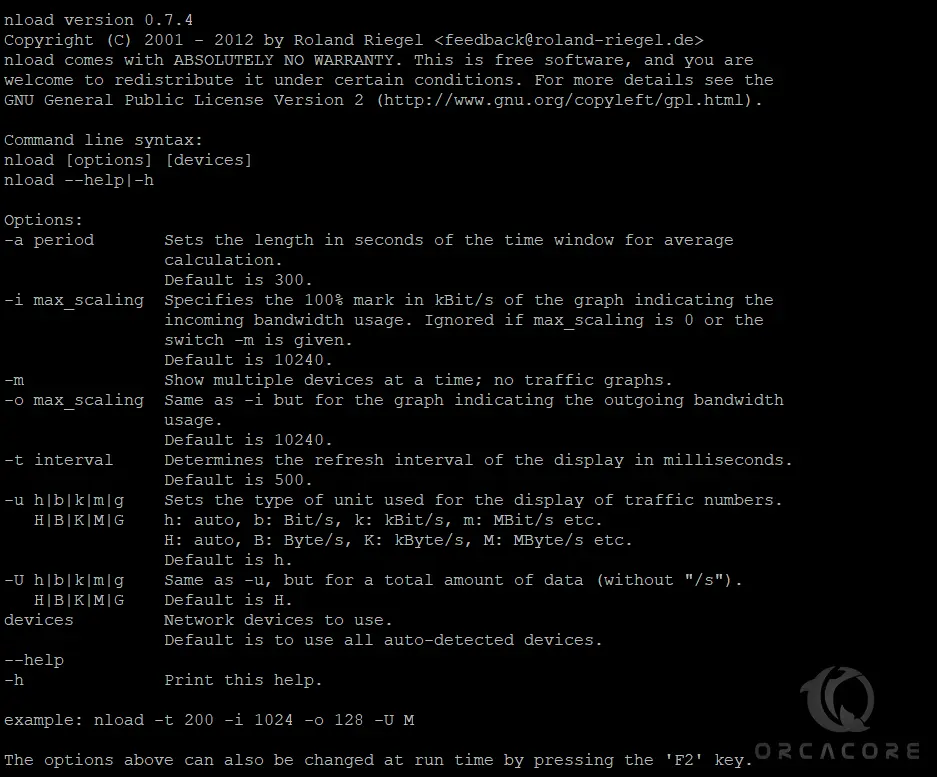
After installing nload, you can see all options available with nload using the following command:
nload --helpYou should see the following screen:
4. Monitor Network Traffic and Bandwidth Usage In Real Time
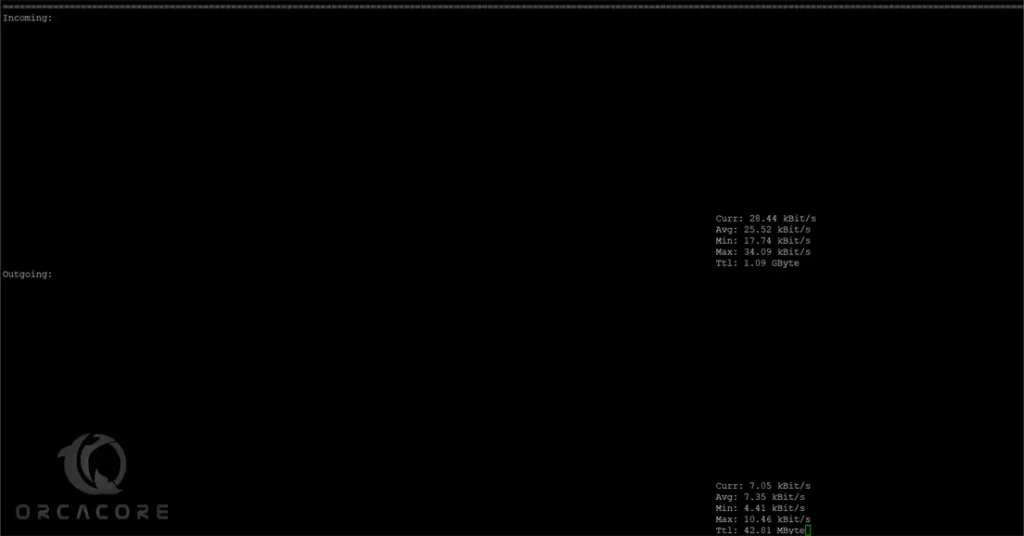
Running the nload command without any options will start monitoring all network devices:
nloadIn your output, you will see something similar to this:
After running the nload command, you can control the monitoring screen using the following shortcut keys:
- The left and right arrow keys or Enter/Tab are used to switch between the devices.
- The F2 key is used to see the options window.
- The F5 key is used to save your current settings.
- The F6 key is used to load your settings from the config file.
- The q key is used to exit from the nload console.
You can press CTRL+C to exit.
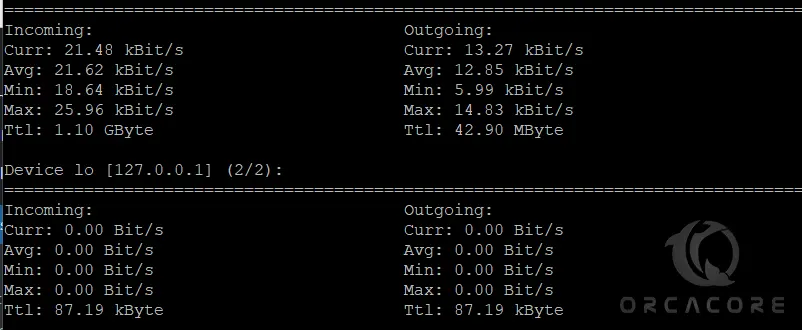
You can use the -m flag with the nload command to display all network interfaces at the same time without the graphs.
nload -mIn the output, you will see something similar to this:
You can use the -a flag with the nload command to set the length in seconds of the time window for average calculation. By default, it is set to 300.
For example, set the duration to 400 seconds as shown below:
nload -a 400You can use the -t flag with the nload command to set the refresh interval of the display in milliseconds. By default, it is set to 500 seconds.
For example, set the refresh interval to 200 as shown below:
nload -t 200You can also define the specific network device with the nload command.
For example, to monitor the eth0 device, use the following command:
nload devices eth0You can also combine all options in a single command to analyze the network traffic according to our needs.
For example, use the following option to monitor all devices with a time window of 300 seconds and a refresh rate of 600 milliseconds.
nload -m -a 300 -t 600Conclusion
At this point, you have learned to Monitor Linux Network Bandwidth Usage with the nload Command. In conclusion, the nload command is a simple and effective tool to monitor real-time network bandwidth usage on Linux. It provides clear visual graphs of incoming and outgoing traffic, helping users track network activity easily.
Hope you enjoy it. Please subscribe to us on Facebook, X, and YouTube.
You may also like to read the following articles:
Introduce Stress Test Tools for CPU