Share your love
Ultimate Guide To Wireshark on Debian 12

This tutorial intends to show you an Ultimate Guide for Installing Wireshark Network Analyzer on Debian 12 from the Command Line. For those who are getting in trouble with Network issues, Wireshark is recommended. In simple words, Wireshark is a free and open-source Network Analyzer Protocol. With Wireshark, you can capture network traffic from ethernet, Bluetooth, wireless, etc., and store the data for offline analysis.
Wireshark will be helpful for the users. Here we provide a list that Wireshark helps in:
| Wireshark Helps |
| Network administrators troubleshoot problems across a network |
| Security engineers examine security issues across a network |
| QA engineers verify applications |
| Developers debug protocol implementations |
| Network users learn about a specific protocol |
Now you can follow the steps below to install Wireshark on Debian 12 Bookworm from the command line interface.
Ultimate Guide To Wireshark on Debian 12
To install Wireshark, you must have access to your server as a non-root user with sudo privileges. For this purpose, you can visit this guide on Initial Server Setup with Debian 12 Bookworm.
Then, follow the steps below to complete this guide.
Step 1 – Install Wireshark on Debian 12 Bookworm
The Wireshark packages are available in most Linux repositories. So you can easily use the APT default repository on Debian 12 to complete your Wireshark installation.
First, run the system update with the command below:
sudo apt updateThen, use the following command to install Wireshark on your Debian server:
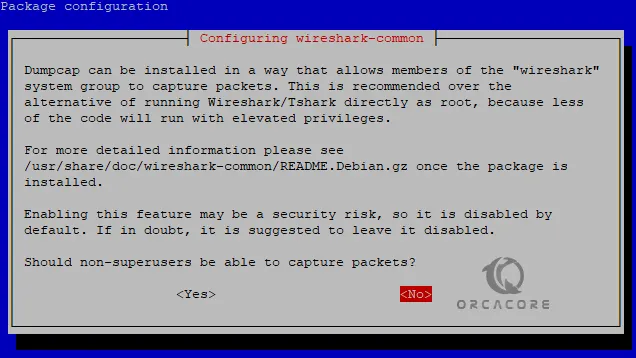
sudo apt install wireshark -yNote: Only users who have sudo privileges access can capture network data. If you want to allow all the users access to Wireshark, during the installation press Y to the question. But it is recommended to don’t do this for security reasons, simply press N to continue.
When your installation is completed, Verify it by using the following command:
sudo apt policy wireshark
In your output you should see:
Output
wireshark:
  Installed: 4.0.6-1~deb12u1
  Candidate: 4.0.6-1~deb12u1
  Version table:
 *** 4.0.6-1~deb12u1 500
        500 https://ftp.debian.org/debian bookworm/main amd64 Packages
        500 https://security.debian.org/debian-security bookworm-security/main amd64 Packages
        100 /var/lib/dpkg/status
As you can see from the output, Wireshark 4.0.6 is installed on Debian 12 Bookworm.
Step 2 – Start the Wireshark App on Debian 12
At this point, you can easily launch and start Wireshark from both the Desktop app launcher and the command line.
To start Wireshark from the command line, you can run the command below in your terminal:
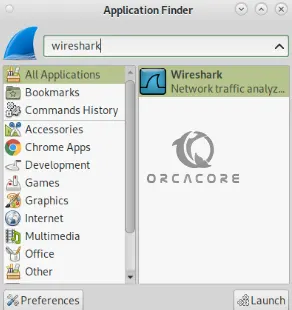
sudo wiresharkOr, from your desktop application finder, search for Wireshark as shown below:
When you launch your Wireshark, you will see the welcome screen:
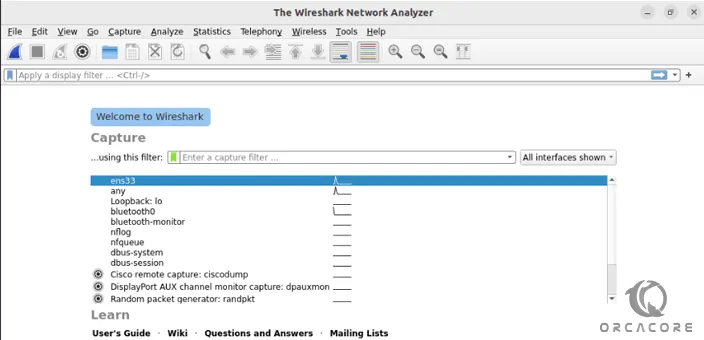
From there, you can easily start your network device to capture data by clicking on the shark icon.
To get more information, you can visit the Wireshark Docs page.
Step 2 – Wireshark Command Line Utility – Tshark
Wireshark provides a command line utility for those who want to work with it from the terminal. The Wireshark command line utility is called tshark. To use tshark, you need to install it on your server with the command below:
sudo apt install tshark -yWhen your installation is completed, you can get a full help of it with the command below:
tshark --helpOutput
TShark (Wireshark) 4.0.6 (Git v4.0.6 packaged as 4.0.6-1~deb12u1)
Dump and analyze network traffic.
See https://www.wireshark.org for more information.
Usage: tshark [options] ...
Capture interface:
-i <interface>, --interface <interface>
name or idx of interface (def: first non-loopback)
-f <capture filter> packet filter in libpcap filter syntax
-s <snaplen>, --snapshot-length <snaplen>
packet snapshot length (def: appropriate maximum)
-p, --no-promiscuous-mode
don't capture in promiscuous mode
-I, --monitor-mode capture in monitor mode, if available
-B <buffer size>, --buffer-size <buffer size>
size of kernel buffer (def: 2MB)
-y <link type>, --linktype <link type>
link layer type (def: first appropriate)
--time-stamp-type <type> timestamp method for interface
-D, --list-interfaces print list of interfaces and exit
-L, --list-data-link-types
print list of link-layer types of iface and exit
--list-time-stamp-types print list of timestamp types for iface and exit
Capture stop conditions:
-c <packet count> stop after n packets (def: infinite)
-a <autostop cond.> ..., --autostop <autostop cond.> ...
duration:NUM - stop after NUM seconds
filesize:NUM - stop this file after NUM KB
files:NUM - stop after NUM files
packets:NUM - stop after NUM packets
Capture output:
-b <ringbuffer opt.> ..., --ring-buffer <ringbuffer opt.>
duration:NUM - switch to next file after NUM secs
filesize:NUM - switch to next file after NUM KB
files:NUM - ringbuffer: replace after NUM files
packets:NUM - switch to next file after NUM packets
interval:NUM - switch to next file when the time is
an exact multiple of NUM secs
Input file:
-r <infile>, --read-file <infile>
set the filename to read from (or '-' for stdin)
Processing:
-2 perform a two-pass analysis
-M <packet count> perform session auto reset
-R <read filter>, --read-filter <read filter>
packet Read filter in Wireshark display filter syntax
(requires -2)
-Y <display filter>, --display-filter <display filter>
packet displaY filter in Wireshark display filter
syntax
-n disable all name resolutions (def: "mNd" enabled, or
as set in preferences)
-N <name resolve flags> enable specific name resolution(s): "mnNtdv"
-d <layer_type>==<selector>,<decode_as_protocol> ...
"Decode As", see the man page for details
Example: tcp.port==8888,http
-H <hosts file> read a list of entries from a hosts file, which will
then be written to a capture file. (Implies -W n)
--enable-protocol <proto_name>
enable dissection of proto_name
--disable-protocol <proto_name>
disable dissection of proto_name
--enable-heuristic <short_name>
enable dissection of heuristic protocol
--disable-heuristic <short_name>
disable dissection of heuristic protocol
Output:
-w <outfile|-> write packets to a pcapng-format file named "outfile"
(or '-' for stdout)
--capture-comment <comment>
add a capture file comment, if supported
-C <config profile> start with specified configuration profile
-F <output file type> set the output file type, default is pcapng
an empty "-F" option will list the file types
-V add output of packet tree (Packet Details)
-O <protocols> Only show packet details of these protocols, comma
separated
-P, --print print packet summary even when writing to a file
-S <separator> the line separator to print between packets
-x add output of hex and ASCII dump (Packet Bytes)
--hexdump <hexoption> add hexdump, set options for data source and ASCII dump
all dump all data sources (-x default)
frames dump only frame data source
ascii include ASCII dump text (-x default)
delimit delimit ASCII dump text with '|' characters
noascii exclude ASCII dump text
help display help for --hexdump and exit
-T pdml|ps|psml|json|jsonraw|ek|tabs|text|fields|?
format of text output (def: text)
-j <protocolfilter> protocols layers filter if -T ek|pdml|json selected
(e.g. "ip ip.flags text", filter does not expand child
nodes, unless child is specified also in the filter)
-J <protocolfilter> top level protocol filter if -T ek|pdml|json selected
(e.g. "http tcp", filter which expands all child nodes)
-e <field> field to print if -Tfields selected (e.g. tcp.port,
_ws.col.Info)
this option can be repeated to print multiple fields
-E<fieldsoption>=<value> set options for output when -Tfields selected:
bom=y|n print a UTF-8 BOM
header=y|n switch headers on and off
separator=/t|/s|<char> select tab, space, printable character as separator
occurrence=f|l|a print first, last or all occurrences of each field
aggregator=,|/s|<char> select comma, space, printable character as
aggregator
quote=d|s|n select double, single, no quotes for values
-t a|ad|adoy|d|dd|e|r|u|ud|udoy
output format of time stamps (def: r: rel. to first)
-u s|hms output format of seconds (def: s: seconds)
-l flush standard output after each packet
-q be more quiet on stdout (e.g. when using statistics)
-Q only log true errors to stderr (quieter than -q)
-g enable group read access on the output file(s)
-W n Save extra information in the file, if supported.
n = write network address resolution information
-X <key>:<value> eXtension options, see the man page for details
-U tap_name PDUs export mode, see the man page for details
-z <statistics> various statistics, see the man page for details
--export-objects <protocol>,<destdir>
save exported objects for a protocol to a directory
named "destdir"
--export-tls-session-keys <keyfile>
export TLS Session Keys to a file named "keyfile"
--color color output text similarly to the Wireshark GUI,
requires a terminal with 24-bit color support
Also supplies color attributes to pdml and psml formats
(Note that attributes are nonstandard)
--no-duplicate-keys If -T json is specified, merge duplicate keys in an object
into a single key with as value a json array containing all
values
--elastic-mapping-filter <protocols> If -G elastic-mapping is specified, put only the
specified protocols within the mapping file
--temp-dir <directory> write temporary files to this directory
(default: /tmp)
Diagnostic output:
--log-level <level> sets the active log level ("critical", "warning", etc.)
--log-fatal <level> sets level to abort the program ("critical" or "warning")
--log-domains <[!]list> comma separated list of the active log domains
--log-debug <[!]list> comma separated list of domains with "debug" level
--log-noisy <[!]list> comma separated list of domains with "noisy" level
--log-file <path> file to output messages to (in addition to stderr)
Miscellaneous:
-h, --help display this help and exit
-v, --version display version info and exit
-o <name>:<value> ... override preference setting
-K <keytab> keytab file to use for kerberos decryption
-G [report] dump one of several available reports and exit
default report="fields"
use "-G help" for more help
Dumpcap can benefit from an enabled BPF JIT compiler if available.
You might want to enable it by executing:
"echo 1 > /proc/sys/net/core/bpf_jit_enable"
Note that this can make your system less secure!
At this point, you can easily use this amazing tool to work with Wireshark from the command line on Debian 12.
Conclusion
At this point, you have learned this Ultimate Guide To Wireshark on Debian 12 Bookworm. You learned to install Wireshark with the APT repository and access the Wireshark Network Analyzer. Also, you have found a utility for Wireshark called tshark, to work with it from the command line interface.
Hope you enjoy using it. Also, you may be interested in these articles on the Orcacore website: