Share your love
Best Darkstat Web Based Linux Network Traffic Analyzer

In this article, we want to show you how to Install and Use Darkstat Web Based Linux Network Traffic Analyzer. As a Linux user, if you plan to analyze network traffic, calculate statistics concerning usage, and serve these reports over HTTPS, The Darkstat tool is a great choice for you.
You can follow this guide on the Orcacore website to install Darkstat on Linux distros, set up a basic configuration, and access it through the web interface. Also, you will learn to manage it from the command line interface.
Table of Contents
Ultimate Guide To Darkstat Web Based Linux Network Traffic Analyzer
To complete Darkstat Web Based Linux Network Traffic Analyzer, you must have access to your Linux server as a root or non-root user with sudo privileges and follow the steps below to start your Darkstat setup on Linux.
Step 1 – Install Darkstat on Linux Distributions
The darkstat packages can be installed by using the Linux package managers. To install Darkstat Web Based Linux Network Traffic Analyzer, you can use the following commands depending on your distros.
For Debian-based distros, you can use:
sudo apt install darkstatFor RHEL-based distros, you can use:
sudo dnf install darkstatStep 2 – Darkstat Configuration Setup on Linux
To use Darkstat Web Based Linux Network Traffic Analyzer, you must make some configuration changes to the /etc/darkstat/init.cfg file. To do this, open the file with your desired text editor like vi editor or nano editor:
vi /etc/darkstat/init.cfgIn the file, find the START_DARKSTAT line and change its value to yes:
START_DARKSTAT=yesThen, be sure that the following lines are uncommented:
INTERFACE="-i eth0"
DIR="/var/lib/darkstat"
PORT="-p 666"
BINDIP="-b 127.0.0.1"
DAYLOG="--daylog darkstat.log"
The values including DIR specify the directory, and DAYLOG specifies the log file. BINDIP is used to specify any specific IP you wish to bind the web interface to.
When you are done, save and close the file.
Note: At this point, you are only able to access the Darkstat Web Interface from the local machine (localhost). To allow access from external machines, you can change the interface with the network interface you use. And for the BindIP, you can change it to the IP from which you plan to access Darkstat, or 0.0.0.0 if you want to allow connections from any other computer.
Step 3 – Allow Connections For Darkstat Through the Linux Firewall
At this point, you must allow connections for Darkstat Web Based Linux Network Traffic Analyzer port 666 through your firewall. To do this, you can use the following commands depending on your distro:
For Debian-based distros with UFW firewall, you can use:
# sudo ufw allow 666/tcp
# sudo ufw reloadTips: To get more information about UFW firewall, you can visit this guide on UFW configuration guide.
For RHEL-based distros with firewalld, you can use:
# sudo firewall-cmd --zone=public --add-port=666/tcp
# sudo firewall-cmd --reloadTips: To get more information about Firewalld, you can check this guide on Firewalld Configuration guide.
Step 4 – Start and Enable Darkstat Service on Linux
At this point, you can use the following commands to start and enable your Darkstat Web Based Linux Network Traffic Analyzer:
# sudo systemctl start darkstat
# sudo /lib/systemd/systemd-sysv-install enable darkstat
You can verify that the Darkstat Web Based Linux Network Traffic Analyzer is active and running with the command below:
sudo systemctl status darkstatOutput
● darkstat.service - LSB: start darkstat monitoring system at boot time
Loaded: loaded (/etc/init.d/darkstat; generated)
Active: active (exited) since Mon 2023-10-02 09:23:08 UTC; 36min ago
Docs: man:systemd-sysv-generator(8)
CPU: 9ms
...Step 5 – Access Darkstat Network Traffic Analyzer through Web Interface
At this point, you have successfully installed and configured Darkstat Web Based Linux Network Traffic Analyzer. Now you can access Darkstat graphs from the web interface by typing your configured IP followed by 666 in your web browser:
http://localhost-or-configured-ip:666Then, you should see the graphical interface of the Darkstat web analyzer tool:
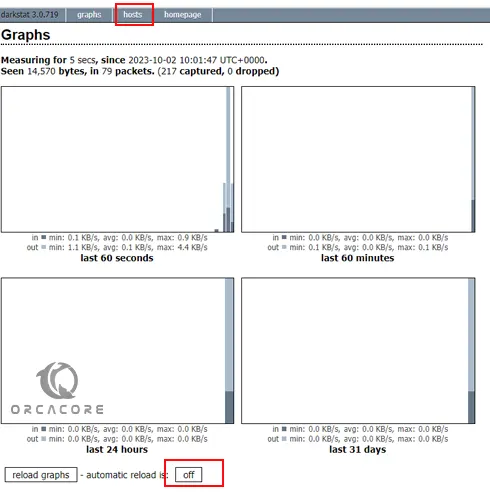
You can load graphs automatically by setting the Automatic reload to On.
Also, you can access the list of hosts by clicking on the host section in the top-right corner of the screen.
Step 6 – Use Darkstat Network Traffic Analyzer via Linux Command Line
At this point, you can use the darkstat via the command line interface. For example, you can collect network statistics on the eth0 interface by using the -i option:
darkstat -i eth0If you want to serve the web page on a specific port, you can use the -p option. For example:
darkstat -i eth0 -p 8080Also, you can monitor the network statistics of a particular service by using the -f option. For example:
darkstat -i eth0 -f "port 22"Step 7 – Shutdown Darkstat Cleanly via Linux Command Line
You can easily shut down the Darkstat network traffic analyzer by getting the process ID of its parent process and then sending a SIGTERM or SIGINT to the Darkstat parent process.
To get the process ID, you can run the command below:
sudo pidof darkstatOutput
16609 16608 16602 16601Then, you can kill the process by using the following commands:
# sudo kill -SIGTERM 16609
OR
# sudo kill -15 16609
You can get more information on Darkstat command line usage with the following command:
man darkstatOutput
NAME
darkstat - network statistics gatherer
SYNOPSIS
darkstat [ -i interface ] [ -r file ] [ --snaplen bytes ] [ --pppoe ] [
--syslog ] [ --verbose ] [ --no-daemon ] [ --no-promisc ] [ --no-dns ]
[ --no-macs ] [ --no-lastseen ] [ -p port ] [ -b bindaddr ] [ --base
path ] [ -f filter ] [ -l network/netmask ] [ --local-only ] [ --chroot
dir ] [ --user username ] [ --daylog filename ] [ --import filename ] [
--export filename ] [ --pidfile filename ] [ --hosts-max count ] [
--hosts-keep count ] [ --ports-max count ] [ --ports-keep count ] [
--highest-port port ] [ --wait secs ] [ --hexdump ]
DESCRIPTION
darkstat is a packet sniffer that runs as a background process, gathers
all sorts of statistics about network usage, and serves them over HTTP.
All settings are passed on the commandline.
OPTIONS
-i interface
...That’s it, you are done.
Conclusion
At this point, you have learned to install Darkstat Web Based Linux Network Traffic Analyzer, set up a basic configuration, and access it through the web interface. Also, you have learned to manage it from the command line interface. Hope you enjoy using it.
You may be interested in these articles:
Execute Shell Commands in Python with Examples