
Share your love
How To Install Grafana on Centos 7

In this article, we want to teach you How To Install Grafana on Centos 7.
Grafana is a free and open-source, general-purpose graph and dashboard composer. It supports many third-party software applications such as Prometheus, PNP, InfluxDB, Graphite, etc. Grafana runs as a web application at default port 3000/TCP.
Steps To Install Grafana on Centos 7
Before you start to set up Grafana on Centos 7, you need to log in to your server as a non-root user with sudo privileges. To do this, you can follow our article the Initial Server Setup with Centos 7.
Also, you need to set up a basic firewall. For this, you can check our article about how to Set up a Firewall with firewalld on Centos 7.
And you should disable SELinux on your server. To do this, you can visit How To Disable SELinux on Centos.
Now you can follow the steps below to set up Grafana on Centos 7.
Install Grafana on Centos 7
There are a few ways to set up Grafana on Centos 7. In this guide, you will install Grafana from its repository.
First, update your local package index with the following command:
sudo yum update
Create Grafana Repository
Then, you need to create a Grafana repo with your favorite text editor, here we use vi:
sudo vi /etc/yum.repos.d/grafana.repo
Add the following contents to the file:
[grafana]
name=grafana
baseurl=https://packages.grafana.com/oss/rpm
repo_gpgcheck=1
enabled=1
gpgcheck=1
gpgkey=https://packages.grafana.com/gpg.key
sslverify=1
sslcacert=/etc/pki/tls/certs/ca-bundle.crt
When you are done, save and close the file.
Now you can use the following command to install Grafana:
sudo yum install grafana
This command will ask you to import the GPG key, and press y to complete your installation.
Manage Grafana Service
After your installation is completed, you need to start the Grafana service on your server with the following command:
sudo systemctl start grafana-server
You can enable your service to start at boot with the command below:
sudo systemctl enable grafana-server.service
Now you can check that your Grafana service is active and running on your Centos 7 with the following command:
sudo systemctl status grafana-server
In your output you will see:
Output
grafana-server.service - Grafana instance
Loaded: loaded (/usr/lib/systemd/system/grafana-server.service; enabled; vendor preset: disabled)
Active: active (running) since Thu 2021-12-09 03:36:45 EST; 1min 56s ago
Docs: http://docs.grafana.org
Main PID: 22378 (grafana-server)
CGroup: /system.slice/grafana-server.service
└─22378 /usr/sbin/grafana-server --config=/etc/grafana/grafana.ini...
Configure Firewall For Grafana
At this point, we assumed that you have enabled firewalld from the requirements. Now you should allow Grafana port through the firewall on Centos 7 with the following command:
sudo firewall-cmd --zone=public --add-port=3000/tcp --permanent
Then, reload the firewall to apply the new rules with the command below:
sudo firewall-cmd --reload
Let’s see how t access the Grafana web interface.
Access Grafana Web Interface
At this point, you can access your Grafana web interface by typing your Server’s IP address followed by 3000:
http://server-ip-address:3000
You will see the Grafana login screen:

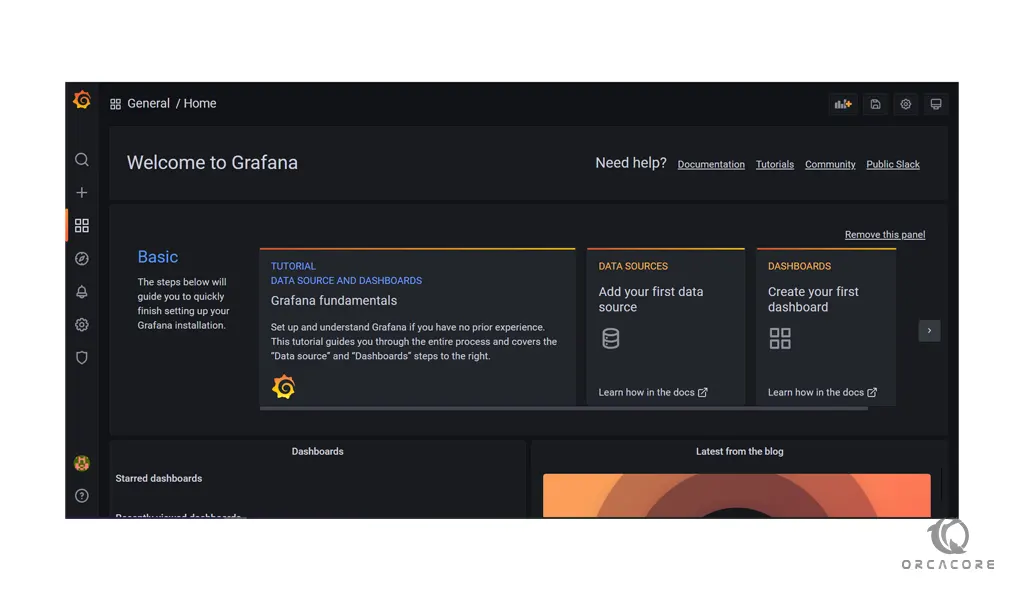
Here you should enter admin for username and password, you will be asked to change your password. After that, you will see the Grafana welcome dashboard:
Conclusion
At this point, you learn to set up Grafana on your Centos 7.
Hope you enjoy using it.
May this article about How To Install Grafana on Ubuntu 20.04 be useful for you.