How To Install Wireshark on AlmaLinux 9

In this guide, you will learn to Install Wireshark on AlmaLinux 9.

Few tools are as useful to the IT professional as Wireshark, the go-to network packet capture tool. Wireshark will help you capture network packets and display them at a granular level. Once these packets are broken down, you can use them for real-time or offline analysis. This tool lets you put your network traffic under a microscope, and then filter and drill down into it, zooming in on the root cause of problems, assisting with network analysis and ultimately network security. 

Steps To Install Wireshark on AlmaLinux 9

To complete this guide, you must log in to your server as a non-root user with sudo privileges. To do this, you can follow our guide on Initial Server Server Setup with AlmaLinux 9.

Installation Steps of Wireshark on AlmaLinux 9

By default, Wireshark packages are available in the default AlmaLinux 9 repository.

First, update your local package index with the following command:

sudo dnf update -y

Then, use the following command to install Wireshark GUI App on your server:

sudo dnf install wireshark -y

Wireshark CLI

 If you do not have GUI/Desktop installed you can install and use Wireshark as a command line tool. To do this, run the command below:

sudo dnf install wireshark-cli -y

Launch Wireshark

You can now launch Wireshark either from the command line or from the activities.

To start Wireshark, run the following command:

sudo wireshark &

You will see the Wireshark interface on AlmaLinux 9:
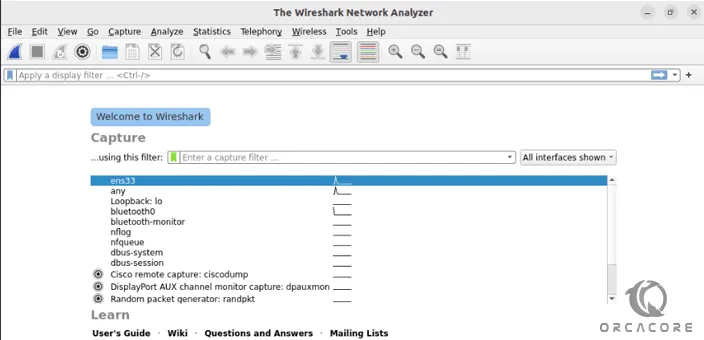
Wireshark dashbaord

Now you can start using your Wireshark. For example, you can Capture the data from available network interfaces. To do this, click on the shark flipper icon in the top left corner to start recording.

In case you wish to use the command line Wireshark tools use the following command:

tshark --help
Output
Usage: tshark [options] ...

Capture interface:
  -i <interface>           name or idx of interface (def: first non-loopback)
  -f <capture filter>      packet filter in libpcap filter syntax
  -s <snaplen>             packet snapshot length (def: appropriate maximum)
  -p                       don't capture in promiscuous mode
  -I                       capture in monitor mode, if available
  -B <buffer size>         size of kernel buffer (def: 2MB)
  -y <link type>           link layer type (def: first appropriate)
  --time-stamp-type <type> timestamp method for interface
  -D                       print list of interfaces and exit
  -L                       print list of link-layer types of iface and exit
  --list-time-stamp-types  print list of timestamp types for iface and exit

Capture stop conditions:
  -c <packet count>        stop after n packets (def: infinite)
  -a <autostop cond.> ...  duration:NUM - stop after NUM seconds
                           filesize:NUM - stop this file after NUM KB
                              files:NUM - stop after NUM files
Capture output:
  -b <ringbuffer opt.> ... duration:NUM - switch to next file after NUM secs
                           interval:NUM - create time intervals of NUM secs
                           filesize:NUM - switch to next file after NUM KB
                              files:NUM - ringbuffer: replace after NUM files
Input file:
  -r <infile>              set the filename to read from (- to read from stdin)

Processing:
  -2                       perform a two-pass analysis
  -M <packet count>        perform session auto reset
  -R <read filter>         packet Read filter in Wireshark display filter syntax
                           (requires -2)
  -Y <display filter>      packet displaY filter in Wireshark display filter
                           syntax
  -n                       disable all name resolutions (def: all enabled)
  -N <name resolve flags>  enable specific name resolution(s): "mnNtdv"
  -d <layer_type>==<selector>,<decode_as_protocol> ...
                           "Decode As", see the man page for details
                           Example: tcp.port==8888,http
  -H <hosts file>          read a list of entries from a hosts file, which will
                           then be written to a capture file. (Implies -W n)
  --enable-protocol <proto_name>
                           enable dissection of proto_name
  --disable-protocol <proto_name>
                           disable dissection of proto_name
  --enable-heuristic <short_name>
                           enable dissection of heuristic protocol
  --disable-heuristic <short_name>
                           disable dissection of heuristic protocol
Output:
  -w <outfile|->           write packets to a pcap-format file named "outfile"
                           (or to the standard output for "-")
  -C <config profile>      start with specified configuration profile
  -F <output file type>    set the output file type, default is pcapng
                           an empty "-F" option will list the file types
  -V                       add output of packet tree        (Packet Details)
  -O <protocols>           Only show packet details of these protocols, comma
                           separated
  -P                       print packet summary even when writing to a file
  -S <separator>           the line separator to print between packets
  -x                       add output of hex and ASCII dump (Packet Bytes)
  -T pdml|ps|psml|json|jsonraw|ek|tabs|text|fields|?
                           format of text output (def: text)
  -j <protocolfilter>      protocols layers filter if -T ek|pdml|json selected
                           (e.g. "ip ip.flags text", filter does not expand child
                           nodes, unless child is specified also in the filter)
  -J <protocolfilter>      top level protocol filter if -T ek|pdml|json selected
                           (e.g. "http tcp", filter which expands all child nodes)
  -e <field>               field to print if -Tfields selected (e.g. tcp.port,
                           _ws.col.Info)
                           this option can be repeated to print multiple fields
  -E<fieldsoption>=<value> set options for output when -Tfields selected:
     bom=y|n               print a UTF-8 BOM
     header=y|n            switch headers on and off
     separator=/t|/s|<char> select tab, space, printable character as separator
     occurrence=f|l|a      print first, last or all occurrences of each field
     aggregator=,|/s|<char> select comma, space, printable character as
                           aggregator
     quote=d|s|n           select double, single, no quotes for values
  -t a|ad|d|dd|e|r|u|ud|?  output format of time stamps (def: r: rel. to first)
  -u s|hms                 output format of seconds (def: s: seconds)
  -l                       flush standard output after each packet
  -q                       be more quiet on stdout (e.g. when using statistics)
  -Q                       only log true errors to stderr (quieter than -q)
  -g                       enable group read access on the output file(s)
  -W n                     Save extra information in the file, if supported.
                           n = write network address resolution information
  -X <key>:<value>         eXtension options, see the man page for details
  -U tap_name              PDUs export mode, see the man page for details
  -z <statistics>          various statistics, see the man page for details
  --capture-comment <comment>
                           add a capture comment to the newly created
                           output file (only for pcapng)
  --export-objects <protocol>,<destdir> save exported objects for a protocol to
                           a directory named "destdir"
  --color                  color output text similarly to the Wireshark GUI,
                           requires a terminal with 24-bit color support
                           Also supplies color attributes to pdml and psml formats
                           (Note that attributes are nonstandard)
  --no-duplicate-keys      If -T json is specified, merge duplicate keys in an object
                           into a single key with as value a json array containing all
                           values
Miscellaneous:
  -h                       display this help and exit
  -v                       display version info and exit
  -o <name>:<value> ...    override preference setting
  -K <keytab>              keytab file to use for kerberos decryption
  -G [report]              dump one of several available reports and exit
                           default report="fields"
                           use "-G help" for more help

For more information, you can visit the Wireshark Documentation page.

Conclusion

At this point, you have learned to Install Wireshark on AlmaLinux 9.

Hope you enjoy it. You may be like these articles:

How To Install Monitorix on AlmaLinux 8

Enable Brotli Compression in Nginx on AlmaLinux 9

Newsletter Updates

Enter your email address below and subscribe to our newsletter

Leave a Reply

Stay informed and not overwhelmed, subscribe now!