Share your love
Best Prometheus Installation and Configuration on Debian 12

This tutorial will teach you Prometheus Installation and Configuration on Debian 12 Bookworm step by step. Prometheus is an open-source software that provides monitoring and alerting cloud-native systems. In this guide from the Orcacore website, you will learn to get the latest Prometheus version from GitHub and access your Prometheus server dashboard via the web interface.
Table of Contents
Steps To Prometheus Installation and Configuration on Debian 12 Bookworm
Before you start your Prometheus installation, you must have access to your server as a non-root user with sudo privileges and set up a basic UFW firewall. For this purpose, you can visit this guide on Initial Server Setup with Debian 12 Bookworm.
Note: If you have a running Debian 11, you can upgrade your server to Debian 12 by visiting the following guide:
Upgrade Debian 11 to Debian 12 from the Command Line
Now proceed to the following steps to complete Prometheus Installation and Configuration on Debian 12.
Step 1 – Create a System User and Group for Prometheus
The first step of Prometheus Installation and Configuration on Debian 12 is to create a Prometheus system user and group. To do this, run the system update and use the commands below to create your user and group:
# sudo apt update
# sudo groupadd --system prometheus
# sudo useradd -s /sbin/nologin --system -g prometheus prometheus
Step 2 – Create Prometheus Data and Config Directories on Debian 12
At this point of Prometheus Installation and Configuration on Debian 12, you must create a data directory for Prometheus to store its data. To do this, run the following command:
sudo mkdir /var/lib/prometheusNext, create the Prometheus config directories by using the following command:
for i in rules rules.d files_sd; do sudo mkdir -p /etc/prometheus/${i}; doneStep 3 – Download Latest Prometheus Binary Package on Debian 12
At this point of Prometheus Installation and Configuration on Debian 12, you can get the latest Prometheus binary package from the GitHub release page under the /tmp/prometheus directory. To do this, run the following commands:
# sudo mkdir -p /tmp/prometheus
# sudo cd /tmp/prometheus
# curl -s https://api.github.com/repos/prometheus/prometheus/releases/latest | grep browser_download_url | grep linux-amd64 | cut -d '"' -f 4 | wget -qi -
Then, use the command below to extract your downloaded file:
sudo tar xvf prometheus*.tar.gzNow navigate to your Prometheus directory on Debian 12 with the command below:
cd prometheus*/From there, move your binary files to the /usr/local/bin/ directory with the command below:
sudo mv prometheus promtool /usr/local/bin/To confirm you have Prometheus installed on your server, you can check its version:
prometheus --versionOutput
prometheus, version 2.47.2 (branch: HEAD, revision: 3f3172cde1ee37f1c7b3a5f3d9b031190509b3ad)
build user: root@79f2ad339b75
build date: 20231012-16:07:10
go version: go1.21.3
platform: linux/amd64
tags: netgo,builtinassets,stringlabelsStep 4 – Prometheus Configuration on Debian 12 Bookworm
Here you need to move the Prometheus configuration templates to the /etc directory. To do this, use the command below:
sudo mv prometheus.yml /etc/prometheus/prometheus.ymlThen, you need to move the console and console binaries to the /etc/prometheus directory with the following command:
sudo mv consoles/ console_libraries/ /etc/prometheus/Now navigate to your home directory with the command below:
cd $HOMECreate Prometheus Systemd Unit File
To manage the Prometheus service with systemd, you need to create a systemd unit file for it. To do this, you can use your favorite text editor like vi editor or nano editor:
sudo vi /etc/systemd/system/prometheus.serviceAdd the following content to the file:
[Unit]
Description=Prometheus
Documentation=https://prometheus.io/docs/introduction/overview/
Wants=network-online.target
After=network-online.target

[Service]
Type=simple
User=prometheus
Group=prometheus
ExecReload=/bin/kill -HUP \$MAINPID
ExecStart=/usr/local/bin/prometheus \
  --config.file=/etc/prometheus/prometheus.yml \
  --storage.tsdb.path=/var/lib/prometheus \
  --web.console.templates=/etc/prometheus/consoles \
  --web.console.libraries=/etc/prometheus/console_libraries \
  --web.listen-address=0.0.0.0:9090 \
  --web.external-url=

SyslogIdentifier=prometheus
Restart=always

[Install]
WantedBy=multi-user.target
When you are done, save and close the file.
Set Correct Permissions and Ownership for Prometheus
At this point of Prometheus Installation and Configuration on Debian 12, you need to change the ownership of these directories to Prometheus user and group by using the following commands:
# for i in rules rules.d files_sd; do sudo chown -R prometheus:prometheus /etc/prometheus/${i}; done
# for i in rules rules.d files_sd; do sudo chmod -R 775 /etc/prometheus/${i}; done
# sudo chown -R prometheus:prometheus /var/lib/prometheus/
Start and Enable Prometheus Service on Debian 12
Now you can start and enable Prometheus service on your Debian 12 with the following commands:
# sudo systemctl daemon-reload
# sudo systemctl start prometheus
# sudo systemctl enable prometheus
Verify your Prometheus service is active and running on Debian 12:
sudo systemctl status prometheusOutput
● prometheus.service - Prometheus
Loaded: loaded (/etc/systemd/system/prometheus.service; enabled; preset: e>
Active: active (running) since Mon 2023-11-06 03:09:15 EST; 15s ago
Docs: https://prometheus.io/docs/introduction/overview/
Main PID: 787 (prometheus)
Tasks: 7 (limit: 4653)
Memory: 20.3M
CPU: 153ms
CGroup: /system.slice/prometheus.service
└─787 /usr/local/bin/prometheus --config.file=/etc/prometheus/prom>Configure Firewall Rules
If your server has a running firewall service, you’ll need to open port 9090 which is the default port for Prometheus. To do this, run the following command:
sudo ufw allow 9090/tcpReload the firewall to apply the new rules:
sudo ufw reloadStep 5 – Access Prometheus Server Dashboard via Web Interface
Now you can confirm that you can connect to port 9090 by accessing the Prometheus server IP address or DNS name in your desired web browser:
http://server-ip:9090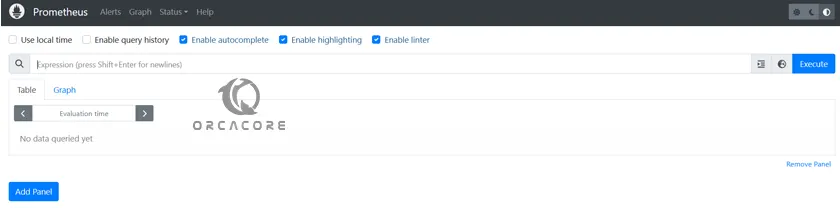
Prometheus doesn’t usually monitor website status, but you can use an exporter to enable this.
Conclusion
At this point, you have learned a step-by-step guide for Prometheus Installation and Configuration on Debian 12 Bookworm. Hope you enjoy using it. Need any help or have an idea, please comment for us.
You may also interested in these articles:
4 Linux Commands to Get Public IP Address
Ubuntu 24.04 Noble Numbat Future LTS Release