
Share your love
Install mtr Command on Linux | Easy and Best Setup
In this guide on the Orcacore website, we want to teach you How To Install mtr Command on Linux and start Using it. MTR (My Traceroute) or Matt’s TraceRoute is one of the most popular Traceroute tools available online. The tool has become one of the go-to tools for replacing Ping and Traceroute. MTR network monitor is an invaluable diagnostic tool that can be used to poll remote servers and measure the change of latency over time.
MTR is a useful tool for a number of reasons. First, it combines Ping and Traceroute together to be able to measure the availability of devices in the network as well as monitor the route. However, it also has a significant advantage over Traceroute because the output is updated continuously. With Traceroute, you have to update scans manually to measure how a network’s performance changes over time.
In contrast, you can run MTR and your information will be connected until you say stop. Being able to monitor the change in network performance over time helps when it comes to troubleshooting.
Table of Contents
Steps To Install and Use the mtr command on Linux
To complete this guide, you can log in to your Linux server as a root or non-root user with sudo privileges. Then, follow the steps below to see how it works.
1. Install mtr Command on Linux
You can easily install mtr on your server. On Debian / Ubuntu systems use the command below to install mtr:
sudo apt install mtr -yOn CentOS / RHEL use the following commands:
# yum install mtr
# dnf install mtr
When your installation is completed, proceed to the next step to start using the mtr command on Linux.
2. How To Use mtr on Linux?
When using the mtr network scanner, you need to generate an mtr report to view your traffic data. mtr reports are directional, so it is necessary to generate reports in both directions to get a complete picture of your network’s performance.
In this section, we’re going to look at:
- Display Hostnames
- Display Numeric IP addresses
- Specify a limit for the number of pings
- Enable Report Mode
- Clear output in Report
- Specify Time Interval between ICMP ECHO requests
- Use TCP SYN packets or UDP datagrams
- Specify packet size
- Print CSV Output
- Print XML Output
- Accessing the mtr help and man page
The basic syntax for the mtr command is as follows:
mtr <option> <hostname>/path Display Hostnames and Numeric IP address
The mtr command displays the hostnames in the traceroute report. To do this, you can use the following command:
mtr [domainName/IP]For example:
mtr google.com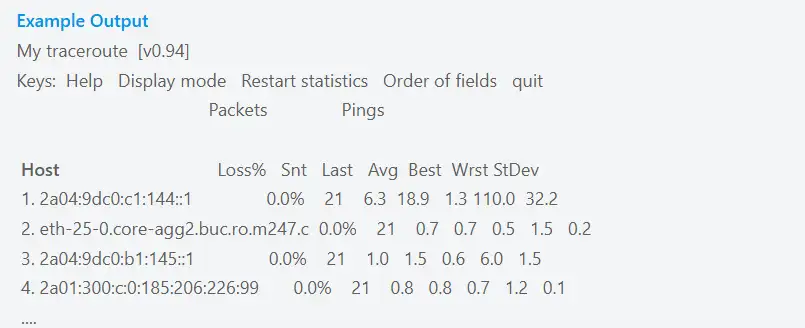
Also, you can use the -g option, to see the numeric IP addresses instead of hostnames:
mtr -g google.comTo see both hostnames and IP addresses, you can use the -b option in the mtr command:
mtr -b google.comSet a limit for the Number of Pings
You can easily configure the mtr command to set a limit for your pings. The syntax used to do this is as follows:
mtr -c [n] “domainname/IP”For example:
mtr -c 10 google.comEnable mtr Report Mode
Instead of looking at the screen all the time, we can let mtr do the job for a while and read the result later with the -r option. For example:
mtr -r google.com
You can specify a ping count for which you want to limit the report through the -c option, and also specify the report filename in which the report will be saved. For example:
mtr -r -c 10 google.com >mtr-report-googleThe report is saved in the current user’s home folder by default. You can, however, specify a proper path for the report to be saved in.
Also, you can clear output in the mtr report mode. To do this, you can add the -w option. For example:
mtr -rw -c 10 google.com >mtr-report-googleSpecify Time Interval
At this point, after Install and use the mtr command on Linux, you can slow down the packets you sent with the -i option:
mtr -i [time-in-seconds] “domainName/IP”For example:
mtr -i 10 google.comThe omitted output is the same as if we don’t use the -i option. The only difference is the slower increase of the value in the Snt column. The default value of -i is 1, so this command is 10 times slower, meaning the interval between sent packets is 10 times longer.
The option is useful when we don’t want to swamp the network with our packets.
TCP and UDP
If you want to use the TCP SYN or the UDP datagrams for requesting mtr instead of the default ICMP ECHO requests, you can do so by using the TCP and UDP flags respectively. Syntax:
$ mtr –tcp “domainName/IP”
$ mtr –udp “domainName/IP”
For example:
$ mtr --tcp google.com
$ mtr --udp google.com
Specify packet size
Through the -s option in the mtr command, you can specify the size, in bytes, of the IP packet for diagnosing network quality.
Syntax:
mtr –r -s [packetsize] “domainName/IP”For example:
mtr -r -s 50 google.comPrint CSV Output
The CSV output of the mtr report delimits the columns with a “,”. With the csv option, you can customize the mtr command to output the report in a CSV format.
Syntax:
mtr –csv “domainName/IP”For example:
mtr --csv google.comPrint XML Output
The mtr command can also support the XML format for printing traceroute reports. The XML report is a good option for automated processing of the output and can be printed by specifying the XML option with the mtr command.
Syntax:
mtr –xml “domainName/IP”For example:
mtr --xml google.commtr help and man page
Finally, after reading the Install and Use the mtr command on Linux article, you can get more options for usage and customization of the mtr command on Linux by reading its help and man page through the following commands:
man mtrmtr --help
Conclusion
At this point, you have learned to Install and Use the mtr command on Linux. The purpose of using the mtr command in Linux is to diagnose network issues by combining the functions of traceroute and ping. It provides real-time insights into network latency and packet loss along the route to a destination, helping troubleshoot connectivity problems.
Hope you enjoy it. Please subscribe to us on Facebook and YouTube.
You may also like these articles:
How To Use Ping Command in Linux