
Share your love
Set up Grafana on Rocky Linux 9: Best Analytics Software

This guide intends to teach you to Set up Grafana on Rocky Linux 9. Grafana is an open-source solution for running data analytics with the help of metrics that give us an insight into the complex infrastructure and massive amount of data that our services deal with, with the use of customizable dashboards.
Grafana connects with every possible data source such as Graphite, Prometheus, Influx DB, ElasticSearch, MySQL, PostgreSQL, etc. The solution’s open-source nature helps us write custom plugins to connect with any data source of our choice.
Now you can follow the steps below on the Orcacore website to Set up Grafana on Rocky Linux 9.
Table of Contents
Steps To Set up Grafana on Rocky Linux 9
To complete this guide, you must log in to your server as a non-root user with sudo privileges and set up a basic firewall. For this purpose, you can visit this guide on Initial Server Setup with Rocky Linux 9.
Grafna Installation on Rocky Linux 9
First, you need to update your local package index with the following command:
sudo dnf update You can install Grafana in a few ways on your server. In this guide, you will learn to install Grafana by using an RPM package.
Download Grafana
Visit the Grafana Downloads page and get the package with the wget command below:
sudo wget https://dl.grafana.com/oss/release/grafana-VERSION.x86_64.rpmsudo wget https://dl.grafana.com/oss/release/grafana-9.1.6-1.x86_64.rpmInstall Grafana on Rocky Linux 9
Then, use the following command to install Grafana:
sudo dnf install grafana-9.1.6-1.x86_64.rpmManage Grafana Service
Once the installation is complete, reload the system daemon with the command:
sudo systemctl daemon-reloadNow start and enable the Grafana service by running the commands below:
# sudo systemctl start grafana-server
# sudo systemctl enable grafana-server
Verify your Grafana service is active and running on Rocky Linux 9:
sudo systemctl status grafana-serverOutput
● grafana-server.service - Grafana instance
Loaded: loaded (/usr/lib/systemd/system/grafana-server.service; enabled; v>
Active: active (running) since Thu 2022-09-22 04:09:53 EDT; 11s ago
Docs: http://docs.grafana.org
Main PID: 5010 (grafana-server)
Tasks: 7 (limit: 23609)
Memory: 39.7M
CPU: 942ms
CGroup: /system.slice/grafana-server.service
└─5010 /usr/sbin/grafana-server --config=/etc/grafana/grafana.ini Configure Firewall For Grafana
The Grafana server listens on port 3000 by default, you can verify this with the command below:
sudo ss -plunt|grep grafanaOutput
tcp LISTEN 0 4096 *:3000 *:* users:(("grafana-server",pid=5010,fd=8))At this point, you need to allow traffic for Grafana on port 3000 through the firewall on Rocky Linux 9. To do this, run the following command:
sudo firewall-cmd --add-port=3000/tcp --permanentNow reload the firewall to apply the new rules:
sudo firewall-cmd --reloadNote: You can customize Grafana by editing the configuration file at /etc/grafana/grafana.ini to suit your preference.
Access Grafana Dashboard
At this step, you can access the Grafana web interface on Rocky Linux 9 by typing your server’s IP address in your web browser followed by 3000:
http://your-server-ip-address:3000You will see the Grafana login screen. At this window, enter admin for the username and password and click Log in.

Then, change the default password of Grafana and click submit.

At this point, you will see the Grafana welcome dashboard screen:
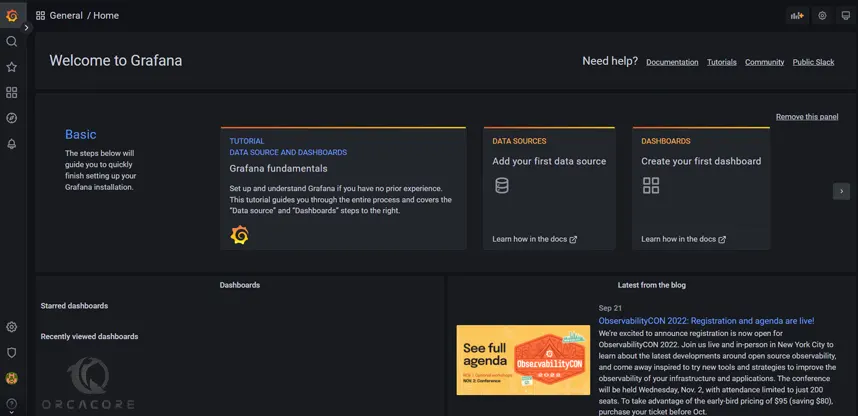
The Grafana dashboard is pretty equipped with various features and is continually evolving which helps us make sense of complex data. From displaying graphs to heatmaps, histograms, Geo maps, and so on.
Conclusion
Grafana Dashboards used for monitoring, visualizing, and analyzing metrics, logs, and data from various sources. It is widely used in IT and DevOps environments to provide insights into the performance and health of applications, servers, and systems. At this point, you have learned to Set up Grafana on Rocky Linux 9.
Hope you enjoy it. You may also interested in these articles:
How To Install Apache Maven on Rocky Linux 9