
Share your love
A Comprehensive Guide To Install Grafana on Ubuntu 24.04

This guide intends to teach you to Install Grafana on Ubuntu 24.04. Grafana is a widely used open-source platform for analytics and monitoring, enabling users to visualize and analyze data from multiple sources. Its interactive and customizable dashboards make it an essential tool for system administrators, developers, and IT professionals.
In this guide, you will learn to install the Grafana OSS version which is free to use. Grafana OSS provides all the core features to create interactive and dynamic dashboards that visualize data from multiple sources.
Now follow the steps below to install Grafana on Ubuntu 24.04 from the Orcacore team.
Table of Contents
Easily Install And Access Grafana on Ubuntu 24.04
To install Grafana, you must log in to your server as a non-root user with sudo privileges. Also, you need to set up a basic firewall with UFW. For this purpose, you can check Basic UFW Firewall Configuration on Ubuntu 24.04.
Then, follow the steps below to complete this guide.
Step 1. Install Grafana on Ubuntu 24.04 with Deb Package
In this guide, we install Grafana by using the Deb binary package. You must visit the Grafana Downloads page, select the latest version available, and choose the OSS edition in this case.
First, run the system update and upgrade with the command below:
sudo apt update && sudo apt upgarde -yAt the current time, the latest OSS version is version 11.0, to download it, you can use the following commands:
# sudo apt-get install -y adduser libfontconfig1 musl
# wget https://dl.grafana.com/oss/release/grafana_11.0.0_amd64.deb
Once your download is completed, install Grafana on Ubuntu 24.04 with the following command:
sudo dpkg -i grafana_11.0.0_amd64.debThen, you can proceed to the next step to enable and start your Grafana server on Ubuntu 24.04.
Step 2. Start and Enable Grafana on Ubuntu 24.04
Once your installation is completed, you must reload the systemd unit configuration files with the following command:
sudo systemctl daemon-reloadNext, start and enable Grafana by using the following commands:
# sudo systemctl enable grafana-server
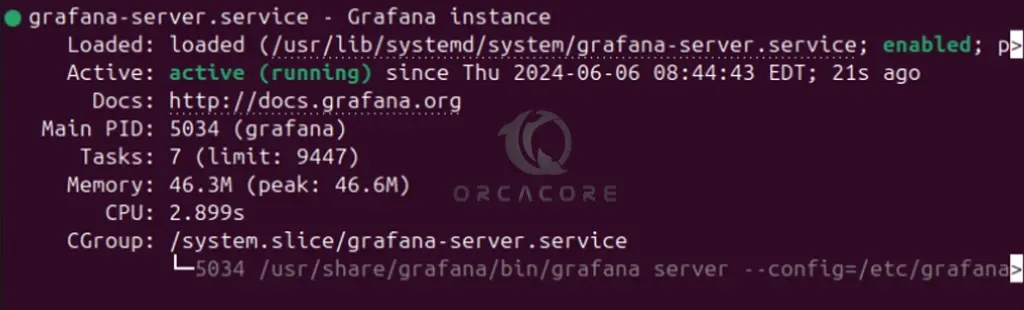
# sudo systemctl start grafana-serverNow you can verify that Grafana is active and running on Ubuntu 24.04 with the following command:
sudo systemctl status grafana-serverIn your output, you should see:
Step 3. Access Grafana Dashboard
As you may know, the default port of Grafana is 3000. You can verify it by using the following command:
sudo ss -altnp | grep grafanaAt this point, you can access your Grafana dashboard by typing localhost in your web browser followed by 3000:
http://localhost:3000Note: For external access, you must allow port 3000 through your UFW firewall with the commands below:
# sudo ufw allow 3000/tcp
# sudo ufw reload
Then, you can access your Grafana dashboard by using the below URL:
http://server-ip:3000Once you access the Grafana UI, you need to enter admin for both username and password. Then, change the password and click submit.
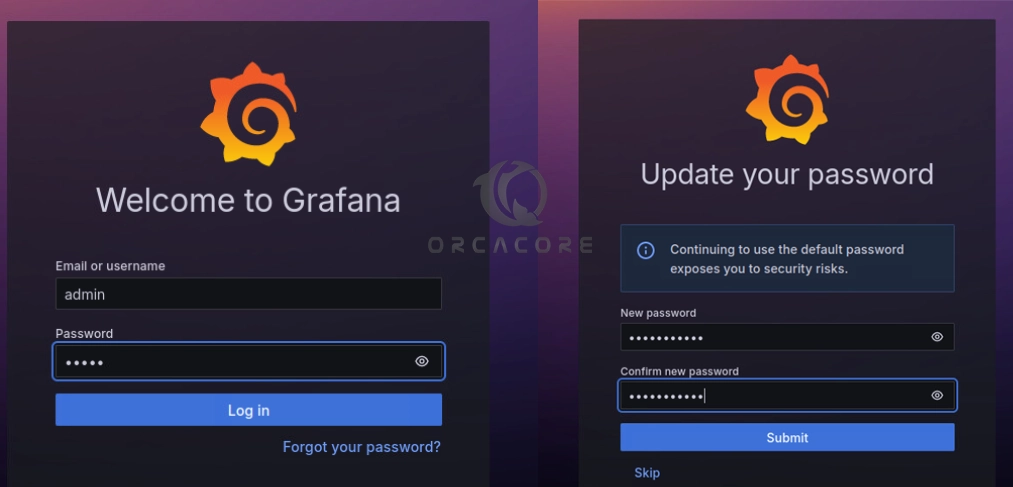
Now you will see your Grafanona dashboard on Ubuntu 24.04.
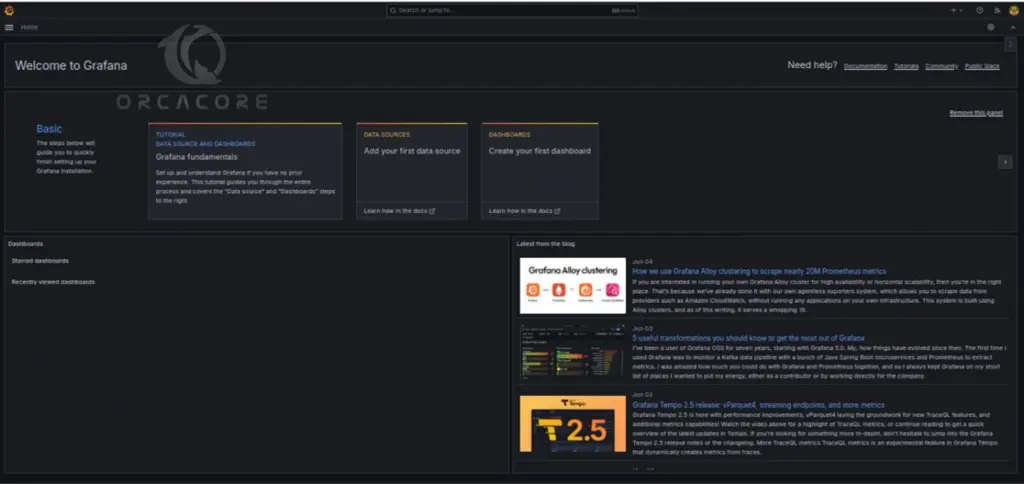
Let’s see how you can create your first dashboard on Grafana.
Step 4. Create your Grafana First Dashboard
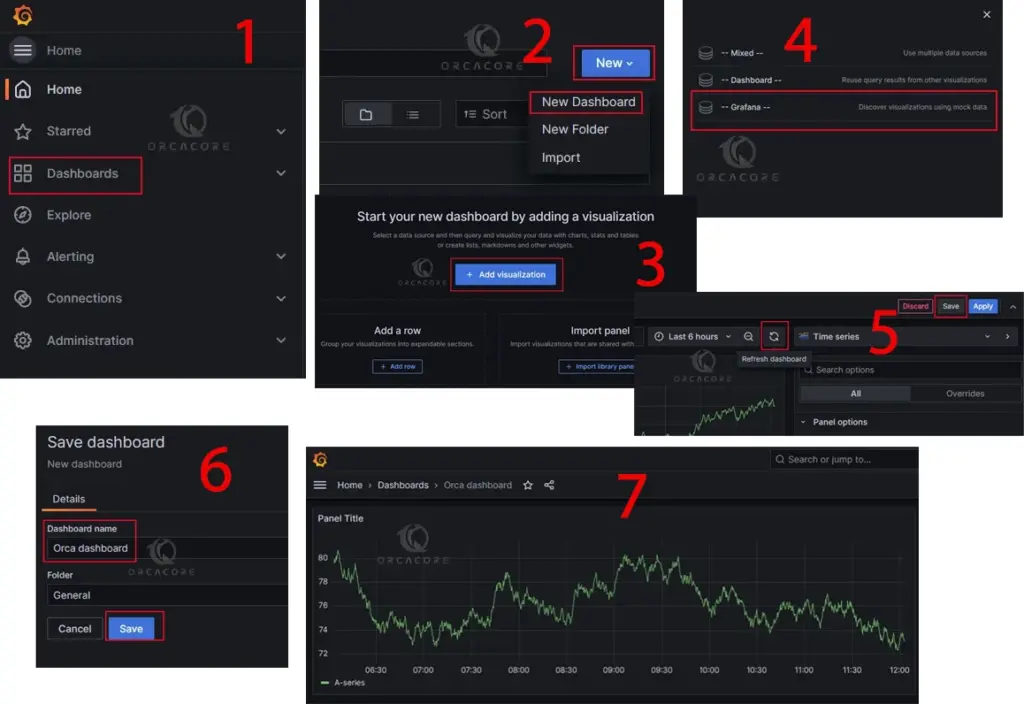
To create your first dashboard, click Dashboards in the left-side menu. Then, click New and select New Dashboard from the dropdown menu. Next, click on + Add visualization. From the data source, click — Grafana —.
This configures your query and generates the Random Walk dashboard. Click the Refresh dashboard icon to query the data source. And click Save to save the dashboard. Enter a name and click save.
That’s it, you have created your first dashboard with Grafana.
The process of creating a new dashboard looks like this:
For more information, you can visit the Grafana Documentation page.
Conclusion
Grafana OSS is a powerful data visualization and monitoring tool. It offers a wide range of features in its open-source version. It excels in integrating diverse data sources, creating customizable dashboards, and providing alerting capabilities. Whether you are managing IT infrastructure, monitoring application performance, or analyzing business metrics, Grafana OSS facilitates informed decision-making with real-time data.
At this point, you have learned to Install Grafana on Ubuntu 24.04 by using the Deb binary package and access your dashboard, and then, create your first dashboard on Grafana.
Hope you enjoy it. Also, you may like to read the following articles:
Monitor Ubuntu Server with Glances Remotely
Installing bmon on Ubuntu 22.04