
Share your love
Best Rocky Linux 9 Network Monitoring Using Nagios
In this guide, we intend to show you Rocky Linux 9 Network Monitoring Using Nagios. Network monitoring is an essential task that every administrator must know about it. Nagios is one of the most useful monitoring tools that is focused on flexibility and power. You can use Nagios to monitor network services, host resources, and server components. It offers you real-time monitoring, alerting, and reporting capabilities.
Nagios has several versions, like Nagios XI, which is a commercial offering with additional features and support, and Nagios Core, the free and open-source version. In this guide, we will set up the Nagios Core free version.
The installation and configuration setup of Nagios can be done in easy steps. To do this, you can proceed to the following steps provided by the Orcacore team to complete Rocky Linux 9 Network Monitoring Using Nagios.
Table of Contents
Step-by-Step Guide To Rocky Linux 9 Network Monitoring Using Nagios
Before you start your Rocky Linux 9 Network Monitoring Using Nagios, you need some requirements. Let’s see what we need.
Requirements Setup For Nagios
First, you must log in to your server as a user with admin privileges and set up a basic firewall. You can check Rocky Linux 9 Initial Setup Guide.
Then, you need to have a Web server installed on your server. In this guide, we use Apache. You can check Apache Web Server Installation on Rocky Linux 9.
Also, you need to have PHP installed on your server. You can get the latest PHP by visiting Install PHP 8.3 on Rocky Linux 9.
Finally, disable your SELinux if you have enabled it on your server.
Now proceed to the following steps to complete Rocky Linux 9 Network Monitoring Using Nagios.
Step 1 – Install Dependencies for Nagios on Rocky Linux 9
Once you are done with the requirements, you need some dependencies and packages for your Rocky Linux 9 Network Monitoring Using Nagios. To do this, you can run the following command:
sudo dnf install php-cli gcc glibc glibc-common gd gd-devel net-snmp openssl-devel wget make gettext autoconf net-snmp-utils perl-Net-SNMP postfix unzip automake tar -yStep 2 – Download Nagios Monitoring Source Code from GitHub
At this point, you must visit the Nagios GitHub Release page to get the latest version. To do this, navigate to your /usr/src/ directory and download your package by using the following wget command:
# cd /usr/src/
# sudo wget https://github.com/NagiosEnterprises/nagioscore/releases/download/nagios-4.5.0/nagios-4.5.0.tar.gz
Once your download is completed, extract it by using the following command:
sudo tar zxf nagios-*.tar.gzNext, switch to your Nagios directory:
cd nagios-4.5.0Step 3 – Start Nagios Monitoring Installation Process on Rocky Linux 9
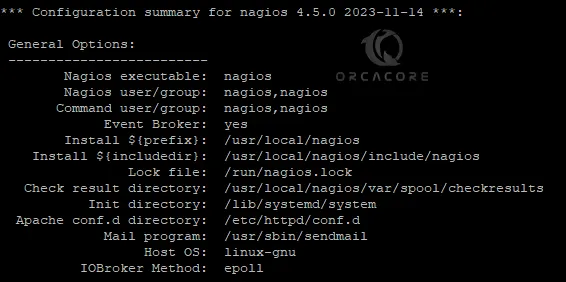
At this point, you can start to compile, build, and install your Nagios network monitoring tool. First, from your Nagios directory, run the command below to make sure your dependencies are OK:
sudo ./configureExample Output:
Then, use the following command to compile Nagios monitoring tool:
sudo make allDepending on your system, this may take some time to complete. Once done, you will get the following output:
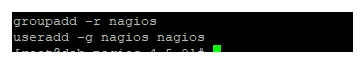
Next, run the following command to create Nagios user and group on Rocky Linux 9:
sudo make install-groups-usersExample Output:
Now you must add your Apache user to the Nagios group with the following command:
sudo usermod -a -G nagios apache
At this point, you can use the following command to install Nagios main program, CGIs, and HTML files:
sudo make install
Also, Nagios can process commands from the external application. To set up Nagios command mode, run the command below:
sudo make install-commandmode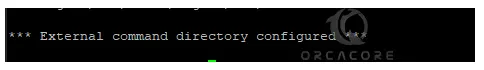
Then, install Nagios sample configuration files on Rocky Linux 9:
sudo make install-config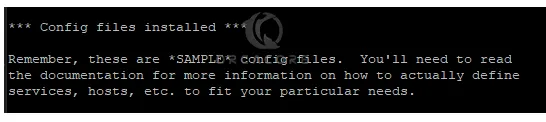
Install Apache config files for Nagios:
sudo make install-webconf
At this point, create a systemd unit file and also configure the Nagios service to start on boot:
sudo make install-daemoninit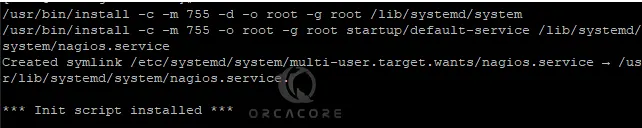
Step 4 – Set up an Admin User for Nagios Network Monitoring
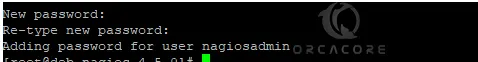
To access Nagios from the web interface, you need to create an admin user for Nagios which is called nagiosadmin. To do this, run the following command:
sudo htpasswd -c /usr/local/nagios/etc/htpasswd.users nagiosadminSet and verify a password for it:
Finally, restart the Apache service:
sudo systemctl restart httpdStep 5 – Nagios Monitoring Plugins Setup on Rocky Linux 9
At this point of Rocky Linux 9 Network Monitoring Using Nagios, you can install the Nagios plugins. Switch to your /usr/src directory:
cd /usr/src/Download the latest version of the Nagios Plugins from the project GitHub repository:
sudo wget -O nagios-plugins.tar.gz https://github.com/nagios-plugins/nagios-plugins/releases/download/2.4.8/nagios-plugins-2.4.8.tar.gzExtract your downloaded file:
sudo tar zxf nagios-plugins.tar.gzSwitch to your Nagios plugins directory:
cd nagios-plugins-2.4.8Run the following commands one by one to compile and install the Nagios plugins on Rocky Linux 9:
# sudo ./configure
# sudo make
# sudo make install
Step 6 – Start Nagios Monitoring Service
At this point, you can easily use the following command to start your Nagios service:
sudo systemctl start nagiosVerify your Nagios monitoring tool is active and running on Rocky Linux 9:
sudo systemctl status nagios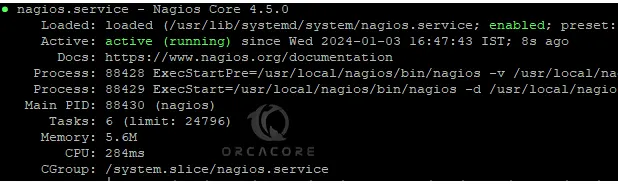
Step 7 – Access Nagios Monitoring Dashboard
In the final step, you access your Nagios Web Interface by typing your server’s IP address in your web browser followed by nagios:
http://server-ip/nagiosNote: Be sure to open firewall rules for HTTP and HTTPS:
# sudo firewall-cmd --permanent --zone=public --add-service=http
# sudo firewall-cmd --permanent --zone=public --add-service=https
# sudo firewall-cmd --reload
Enter the nagiosadmin user login credentials and click sign in:
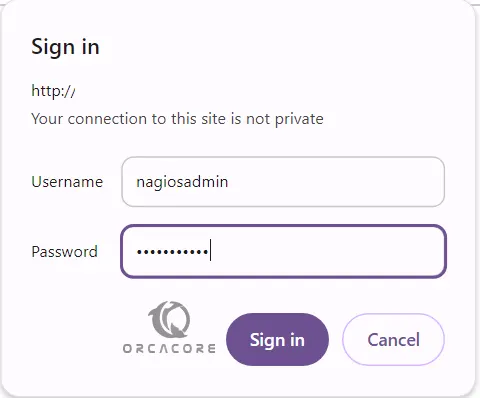
You will see your Nagios home page dashboard.
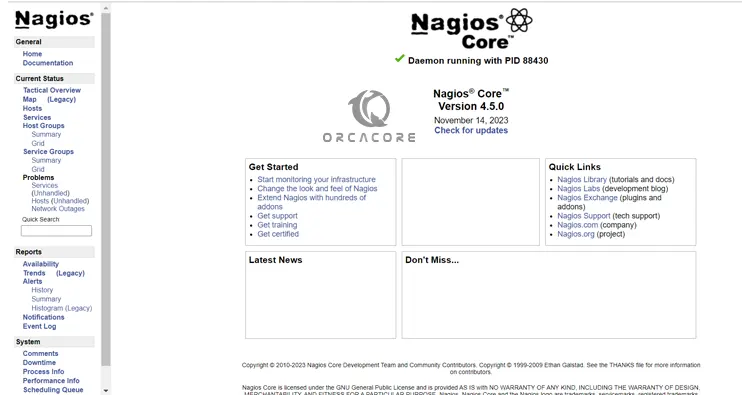
From the left-side menu, you can click Tactical Overview to check your monitoring performance. Also, you can see your hosts and services and monitor your server by using Nagios.
The Nagios dashboard offers different views, detailed reports, and historical data, which can be invaluable for troubleshooting and long-term planning.
Conclusion
Nagios is highly scalable and capable of monitoring large and complex environments. At this point, you have learned the step-by-step guide to Rocky Linux 9 Network monitoring using Nagios. Hope you enjoy it.
Also, you may like to read the following articles:
The Ultimate smartctl Hard Drive Monitoring Guide on Linux
Command To Search Audit Logs in AlmaLinux / RHEL
Fix Apache Shuts Down Unexpectedly
Elasticsearch Installation Guide on AlmaLinux 9
FAQs
How does Nagios improve network monitoring?
Nagios increases network monitoring by providing a robust, scalable, and flexible tool. It has a strong community and a wealth of resources for support and extension.
Can Nagios monitor cloud-based services?
Yes, Nagios can monitor cloud-based services. It can do this, because of the following features:
-API Monitoring
-Integration with Cloud Platforms
-Hybrid Environment Monitoring
-Custom Plugins for Cloud Services
-Cloud Metrics Monitoring
-Scalability
-Alerts and Notifications
-Cost Management
What are the security features in Nagios?
Nagios provides several security features to increase security. These features include:
-User Authentication and Authorization
-Data Encryption
-Secure Configuration
-Regular Updates and Patches
-Isolation and Privilege Management
-Plugin Security
-Audit Trails and Logging
-Network Segmentation and Firewalls
-Access Control Lists (ACLs)
-Remote Execution Security
These features make Nagios a good monitoring service for essential IT environments.