Share your love
Best Linux System Monitoring GUI Tools
This tutorial intends to introduce the Best Linux System Monitoring GUI Tools. Every Linux Administrator needs Tools to monitor the system. Here we want to display some Tools for monitoring servers that can be accessed through the Web GUI. Some of them are available for free or have a trial version. First, let’s see what is system monitoring and get through the Best Linux System Monitoring GUI Tools.
Table of Contents
What is System Monitoring in Linux Server?
When the word System Monitoring comes up, means that you can track every piece of information on your server. You can use monitoring tools to track your CPU and memory usage, how much storage you have, check your hardware temperature, the activity of your network, etc.
Here you can see the following list of why system monitoring is so helpful.
| Benefits of Linux System Monitoring |
| Detect all the server and network problems. |
| Find the root cause of the failure. |
| Help in reducing the maintenance cost. |
| Troubleshoot the performance issues. |
| Help to update system before it gets outdated. |
| Fix problems automatically when detected. |
| Make sure the servers, services, applications, and network is always up and running. |
| Help to update the system before it gets outdated. |
Introduce the Best Linux System Monitoring GUI Tools
Now you can follow the rest of the article to learn some of the Best Linux System Monitoring GUI Tools. These tools will help Linux administrators to track their servers and can protect them from every danger.
Tool 1 – Zabbix Monitoring Software
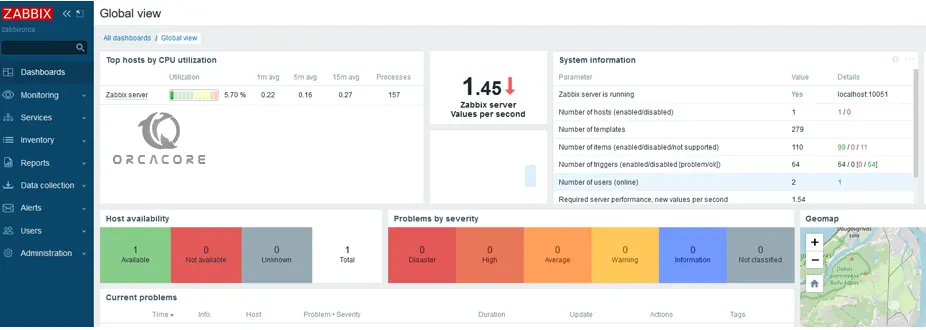
One of the Best Linux System Monitoring GUI Tools is Zabbix. It has a lot of popularity and usage among Linux users. Zabbix is an open-source monitoring tool that can do a lot of stuff. It can be used to monitor network usage, CPU load, services, etc.
Also, it can support other operating systems such as Windows, MacOS, and many more.
Zabbix provides an amazing dashboard that can be accessed from the Web GUI. From the Zabbix dashboard, you can view your IT components.
At this point, we provide you with a list of features and advantages of Zabbix to see why this monitoring tool is so popular.
| Zabbix Monitoring Tool | Features | Advantages |
| 1 | Visualization | Nice web interface |
| 2 | Zabbix API | Monitor both server and network devices |
| 3 | Notification and remediation | Flexibility in decentralizing users |
| 4 | Effortless deployments | Easy to manipulate and configure |
| 5 | Security and authentication | Supports many Operating Systems |
| 6 | Metric collection | Trusted in user authentication |
| 7 | Problem detection | Report problems via email and SMS |
| 8 | Distributed monitoring | etc. |
These amazing features and advantages make Zabbix a great monitoring tool for Linux administrators.
Tips: You can visit the Orcacore website to get Zabbix installation and configuration guides on Linux distros. Here are the two last stable Zabbix installations on the following servers:
Install Zabbix 6.4 on Ubuntu 22.04
Install Zabbix 6.4 on AlmaLinux 9
Tool 2 – Grafana Analytics and Monitoring Tool
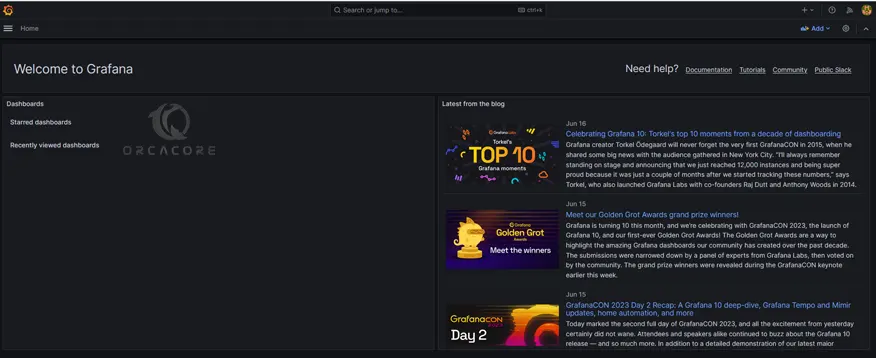
At this point, we go with another amazing monitoring tool named Grafana. It is an open-source tool that can be used to analyze and monitor data. By using Grafana you can track the user’s and app behaviors, and track the system errors. Also, Grafana can connect with every possible data source. The data sources can be Graphite, Prometheus, Influx DB, ElasticSearch, MySQL, PostgreSQL, etc.
Grafana comes with a dashboard that pulls data from plugged-in data sources. It has many features that you can use to monitor and analyze your server.
Tips: If you are looking for Grafana guides, you can visit our website. For example, the two below guides provide the Grafana installation and usage on:
Install Grafana on Windows Server 2022
Install Grafana on Debian 12 Bookworm
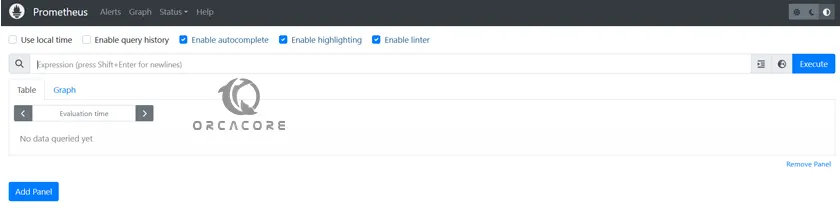
Tool 3 – Prometheus Monitoring System Tool
At this point, we intend to introduce another Best Linux System Monitoring GUI Tools. Prometheus is an open-source and free monitoring and alerting toolkit. With Prometheus you can collect and store metrics as time-series data, recording information with a timestamp. Also, you can collect and record labels, which are optional key-value pairs.
Here we provide a key feature list of Prometheus to see why it is a good choice for your system monitoring.
| Prometheus Monitoring Tool | Features | Description |
| 1 | Multidimensional data model | Using time-series data, which is identified by metric name and key-value pairs. |
| 2 | PromQL | A flexible querying language that can leverage the multi-dimensional data model. |
| 3 | No reliance on distributed storage | single server nodes are autonomous. |
| 4 | Pull model | Prometheus can collect time-series data by actively “pulling” data over HTTP. |
| 5 | Pushing time-series data | Available through the use of an intermediary gateway. |
| 6 | Monitoring target discovery | Available through static configuration or service discovery. |
| 7 | Visualization | Prometheus offers multiple types of graphs and dashboards. |
Also, you can use Grafana with Prometheus. Prometheus collects rich metrics and provides a powerful querying language; Grafana transforms metrics into meaningful visualizations.
Tips: You can use the following links to see examples of Prometheus server installation setup:
Set up Prometheus Server on AlmaLinux 9
Install and Configure Prometheus on Ubuntu 22.04
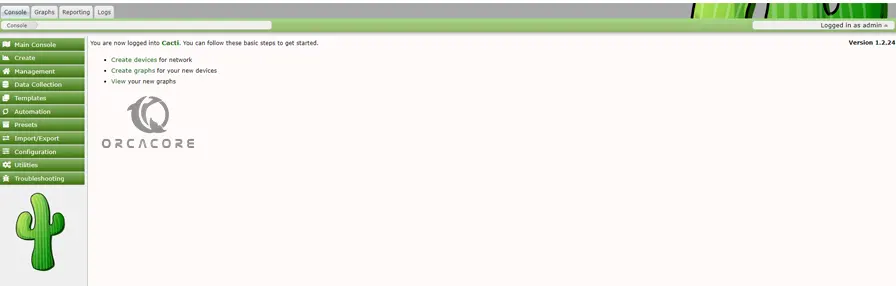
Tool 4 – Cacti Network Monitoring and Management Tool
At this point, we want to talk about the Cacti GUI monitoring tool. Cacti is an open-source mentoring and management tool that has a graphical interface for RDDTool (Round Robin Tool). It can be used to track the CPU and memory usage, bandwidth, speed, ad network monitoring, etc.
Cacti is a good choice for monitoring your system equipment over time.
Tips: You may find that Cacti installation is not easy. For this purpose, we provided you with amazing guides that you can use to configure and access your Cacti dashboard. The following are the examples of the Cacti installation:
Install and Configure Cacti on Ubuntu 22.04
How To Install and Configure Cacti on Centos 7
Install and Configure Cacti on AlmaLinux 8
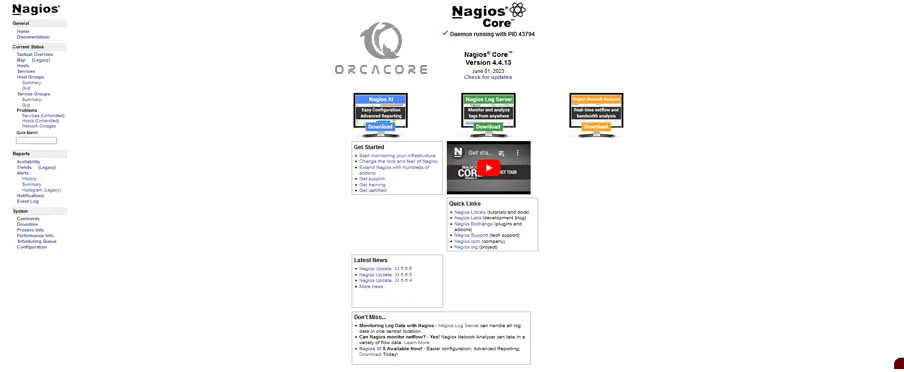
Tool 5 – Nagios System Monitoring Software
Nagios is one of the Best Linux System Monitoring GUI Tools that can be used to monitor networks, applications, and servers. With Nagios, you can find and fix the issues in your system and protect the system from future damage cause.
At this point, we provide the following list to know Nagios better and why it is one of the best tools for monitoring Linux systems.
| Nagios Monitoring Tool | Features | Advantages |
| 1 | Monitor Server Databases | Help to get rid of periodic testing |
| 2 | Give application level information | Detect split-second failures when the wrist strap is still in the “intermittent” stage |
| 3 | Provide active development | Reduce maintenance cost without sacrificing performance |
| 4 | Excellent support form many communities | Provide timely notification to the management of control and breakdown |
| 5 | Can be run on any operating systems | Informative and attractive web interfaces |
| 6 | Has a ping feature to see if host is reachable | etc. |
These are some of the features and benefits of Nagios that are good reasons to use it for your system monitoring.
Tips: Just like other monitoring tools, you can find the installation guides of Nagios on our website. Here are two examples of Nagios Setup on Linux:
Nagios Core Installation on Debian 12 Bookworm
Install and Configure Nagios on Rocky Linux 8
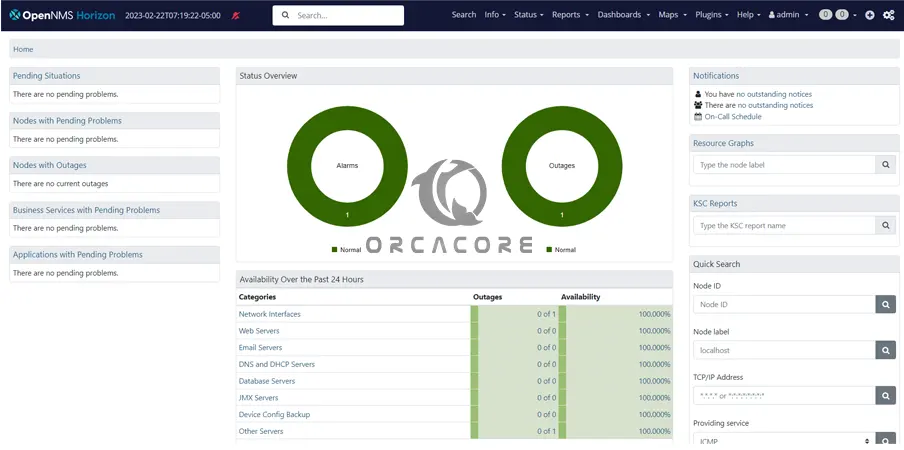
Tool 6 – OpenNMS Network Monitoring Platform
Another Best Linux System Monitoring GUI Tools is OpenNMS. It is a free and open-source network monitoring and management tool. OpenNMS provides reliable, scalable, performance, and network traffic monitoring through the web interface.
OpenNMS has many amazing features that make it a good tool for system monitoring. You can see them in the following list.
| OpenNMS Monitoring Tool | Features |
| 1 | SNMP Monitoring |
| 2 | Auto Discovery |
| 3 | IPV6 Support |
| 4 | Interface Error Data |
| 5 | Passive Fault Detection |
| 6 | Fast Polling |
| 7 | Clear Correlation |
| 8 | Network Discard Data |
| 9 | Average Response Time Data |
| 10 | Power Supply Monitoring |
| 11 | Utilization and Error Rates |
| 12 | Reporting |
You can easily use OpenNMS via Web GUI to do your system monitoring.
Tips: At this point, you can follow the below example guides to see an OpenNMS setup on Linux:
Set up OpenNMS on Ubuntu 20.04
Install and Configure OpenNMS on AlmaLinux 9
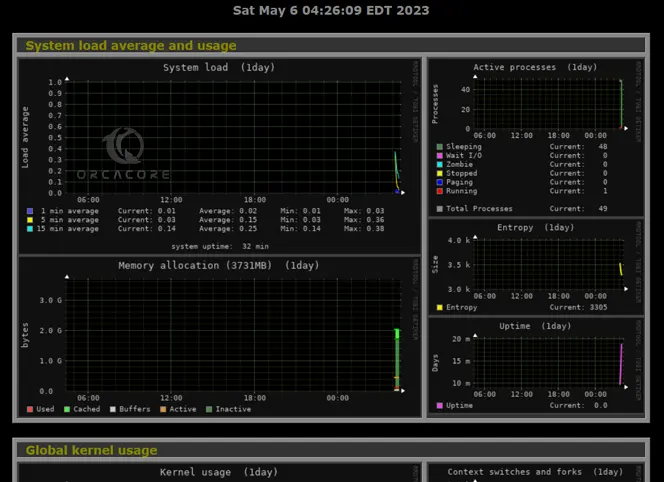
Tool 7 – Monitorix Lightweight System Monitoring Tool
Monitorix is one of the lightweight and powerful monitoring tools that is available for free and open-source in Linux distributions. With Monitorix you can do many tasks such as monitor CPU load and temperature, Network device activity, and Network services.
It has an easy setup on Linux distributions and you can easily access Monitorix dashboard and monitor your system by performing simple and Multi-Host monitoring.
Tips: To see the Monitorix installation and usage, you can follow the below example guides:
Install Monitorix on Debian 11
Install Monitorix on AlmaLinux 8
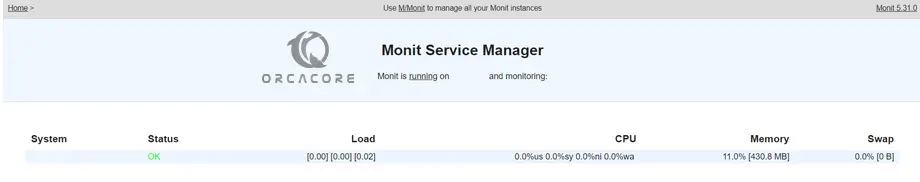
Tool 8 – Monit Manager and Monitoring Tool
Monit is a small open-source monitoring tool for Linux distributions that is available for free. It is easy to use and automatically monitors and manages processes, files, directories, services, etc. Also, you can monitor remote hosts’ TCP/IP port, server protocols, and ping with the Monit tool.
You can easily add services to your Monit service manager dashboard and monitor your services.
Tips: To see how you can set up Monit on your Linux servers, you can visit our website. For example, these tutorials provide Monit installation and usage on:
Install and Use Monit on AlmaLinux 8
Install and Configure Monit Manager on Ubuntu 20.04
Conclusion
At this point, you have found the Best Linux System Monitoring GUI Tools. Each of them has its unique features and advantages that every Linux administrator can benefit from. We try to introduce them in detail and provide the installation examples for you.
So what do you think of Linux monitoring? Think which one you will use. We will be glad to share your ideas and comments with us.
Also, you can visit Monitoring Tutorials to get more information about system monitoring.